


Dashboard and research-view guides
Ten core dashboards and eight specialist research views, each documented with a real screenshot. Every guide states the question the screen answers, the fields it shows, the order to read them in, and the boundary past which a score, level or label stops being evidence.
- Pages on this topic
- 27
- Where to start
- Start at the tools hub, read the guide for the dashboard you are actually looking at, and follow its link to the concept guide behind it.
- Applies to
- US-listed stock and ETF options
- Purpose
- Independent research and education
On-screen labels are classifications, not instructions
Words that appear in the interface, bullish, bearish, conviction, edge, magnet, support, resistance, are model classifications applied to observed data. They describe how the software has grouped something, not what will happen and not what to do.
Read the supporting context
Every screenshot on this site is a historical capture. The values in it were true at the moment of capture and are not live, representative or repeatable.
Screens, tools and comparisons
- Options trading dashboard for connected market researchAn options trading dashboard should connect market-wide flow, ticker activity, strike and expiry positioning, underlying price and catalysts in one research path.
- Options scanner: the four types and which one you needAn options scanner is software that watches the US options market and surfaces contracts or tickers that meet a condition, so activity worth reviewing appears without reading the chain by hand.
- Options trading platform or options analytics platform?An options trading platform is where you place orders through a broker such as Tastytrade, thinkorswim, Interactive Brokers, Schwab, Robinhood or Webull.
- Options trading and analysis tools, organized by jobThe options research toolkit divides into seven jobs: reading the chain and quotes, tracking flow and unusual activity, mapping positioning and dealer exposure, measuring volatility, modelling a strategy's payoff, following news and the calendar, and reviewing your own past decisions.
Dashboard guides
- Weighted Net Flow dashboardWeighted Net Flow compares estimated call pressure and put pressure with sentiment and the underlying price on one intraday chart.
- Premium Heat Grid dashboardThe Premium Heat Grid maps call and put premium, gamma exposure and vanna exposure across strike and expiry.
- Flow Map and Greeks by Strike dashboardThe Flow Map ranks bullish and bearish ticker activity while the adjacent strike chart plots gamma, vanna and charm.
- 0DTE and GEX dashboardThe 0DTE and GEX dashboard plots estimated same-day gamma exposure by strike around the current price.
- Contract Positioning dashboardContract Positioning is a history view for large or notable options activity.
- Market News Context dashboardThe Market News Context dashboard filters recent headlines by ticker, source and category so options activity can be checked against reported catalysts.
- Sector options flow dashboardA sector options flow dashboard groups call- and put-side activity across market sectors, then ranks the individual tickers contributing to each group.
- Algo Flow and Top Tickers dashboardThe Algo Flow and Top Tickers dashboard compares call and put volume through the session with the underlying price and ranked ticker activity.
- Flow Trend dashboardThe Flow Trend dashboard tracks options premium, volume, put/call ratio and trade count across time.
- Premium by strike with open interestThis view stacks intraday net options premium by strike above call and put open interest at the same strikes.
- Open Interest Heatmap ToolThe Realtime Options Open Interest Heatmap is an interactive strike-by-expiry grid for inspecting where one symbol's outstanding contracts are concentrated.
- Options Volume Change scannerThe Options Volume Change scanner ranks symbols whose classified options activity changed most within the selected comparison window.
- Open Interest LensOpen Interest Lens maps the latest cleared call and put open-interest snapshot by strike and overlays runtime quote-side execution evidence for a selected expiry and contract.
- Swing Contract CompassSwing Contract Compass combines a multi-session price structure, moving-average slopes, RSI, execution pressure, expiry participation and a contract shortlist.
- Contract Activity ReviewContract Activity Review plots options contracts using classified premium, urgency, sweep share, persistence and recency, then records whether defined historical comparison conditions were met.
- Premium EdgePremium Edge compares the move implied by an expiry's option pricing with the underlying's observed movement across comparable historical windows.
- Magnet Levels dealer-gamma viewMagnet Levels ranks strikes using a flow-signed estimate of dealer gamma and labels call walls, put walls, modeled magnets and the gamma-flip area around spot.
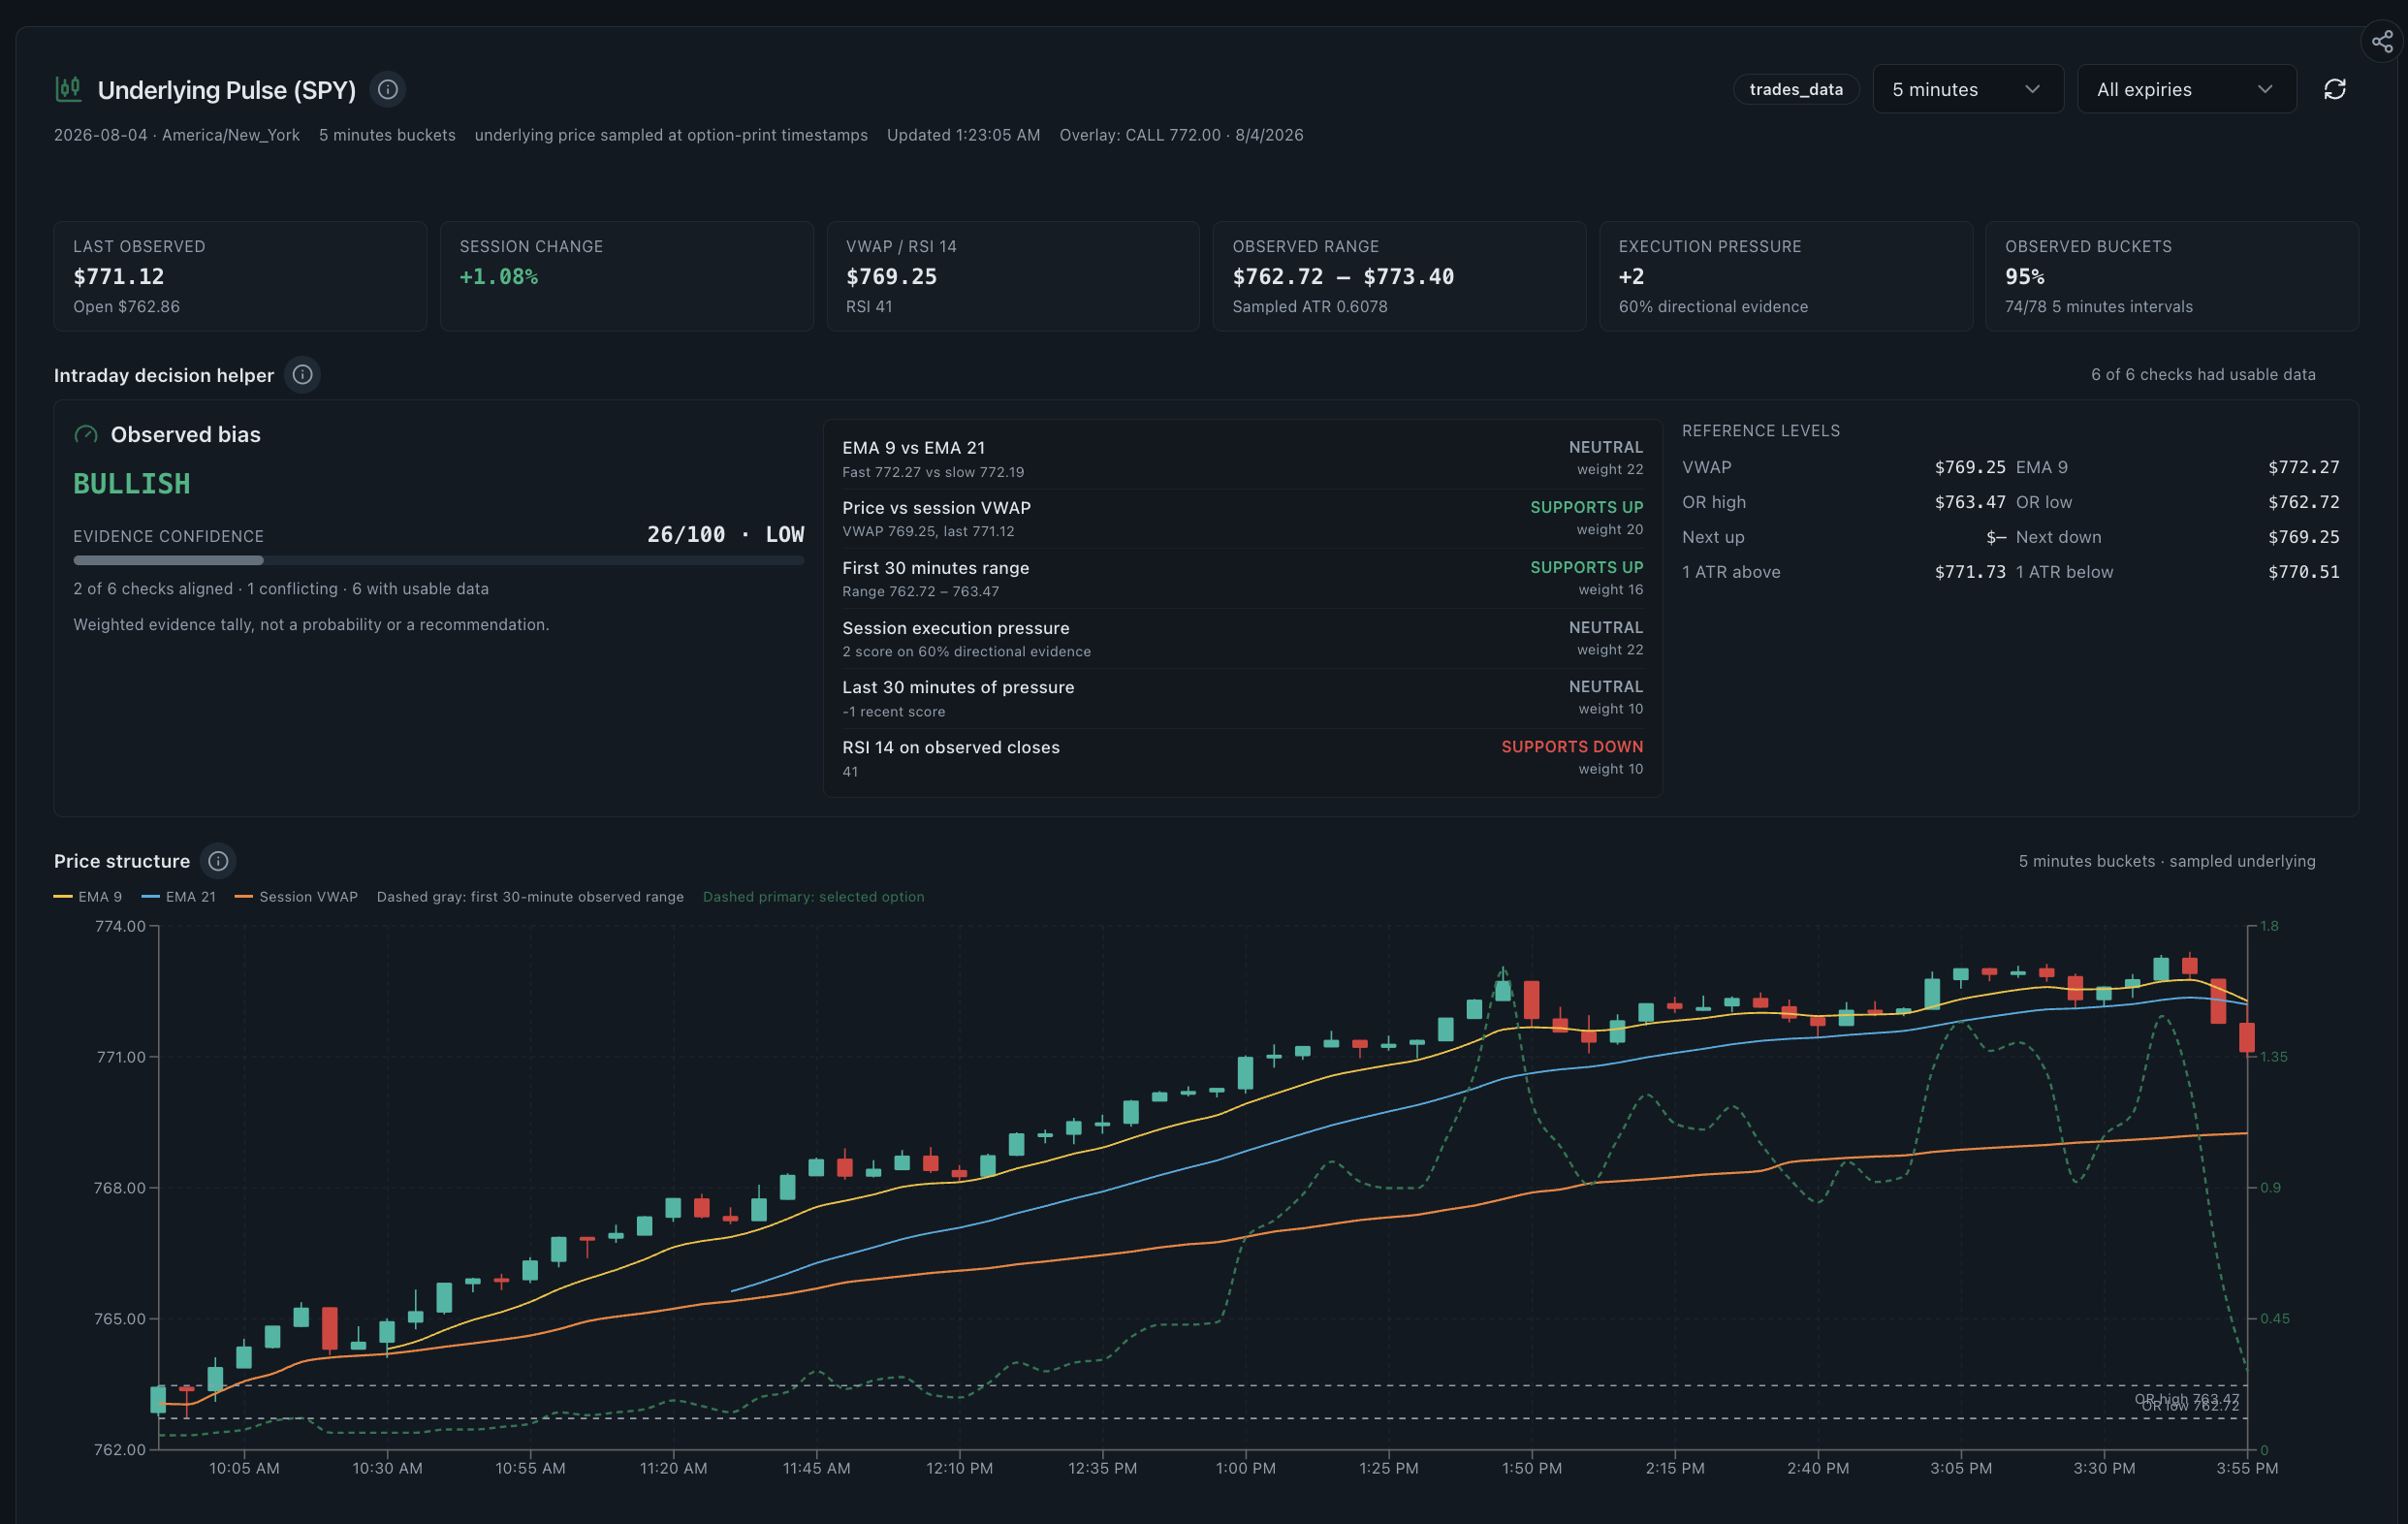
- Underlying PulseUnderlying Pulse aligns sampled intraday price, VWAP, moving averages, RSI, execution pressure, call and put participation and expiry concentration on a shared time axis.
- Historical Options Flow AnalysisHistorical Flow Analysis summarises call premium, put premium, net flow, trade counts, volume and symbol breadth across a chosen grouping.
Applied workflows and method posts
- How to read sector options flowSector options flow groups executed options activity by market sector, then compares call- and put-side premium across the group and its active tickers.
- How to read an open interest heatmap beside options flowAn open interest heatmap shows where outstanding call and put contracts sit across strikes using the latest cleared daily figures.
Common questions
Are the screenshots live data?
No. They are historical captures from August 2026. Prices, scores, labels and levels change with the market data selected, and nothing in a screenshot should be read as a current or expected value.
Do I need every dashboard?
No. Most routines use three or four. The guides exist so you can tell which ones answer your question rather than opening all of them.