


Options Greeks by strike
Options Greeks by strike group model-derived sensitivities at each exercise price so a researcher can see where delta may respond to price, volatility and time. Gamma estimates delta change with the underlying; vanna relates delta or option value to volatility; charm relates delta to time. All are theoretical estimates, not exact forecasts.
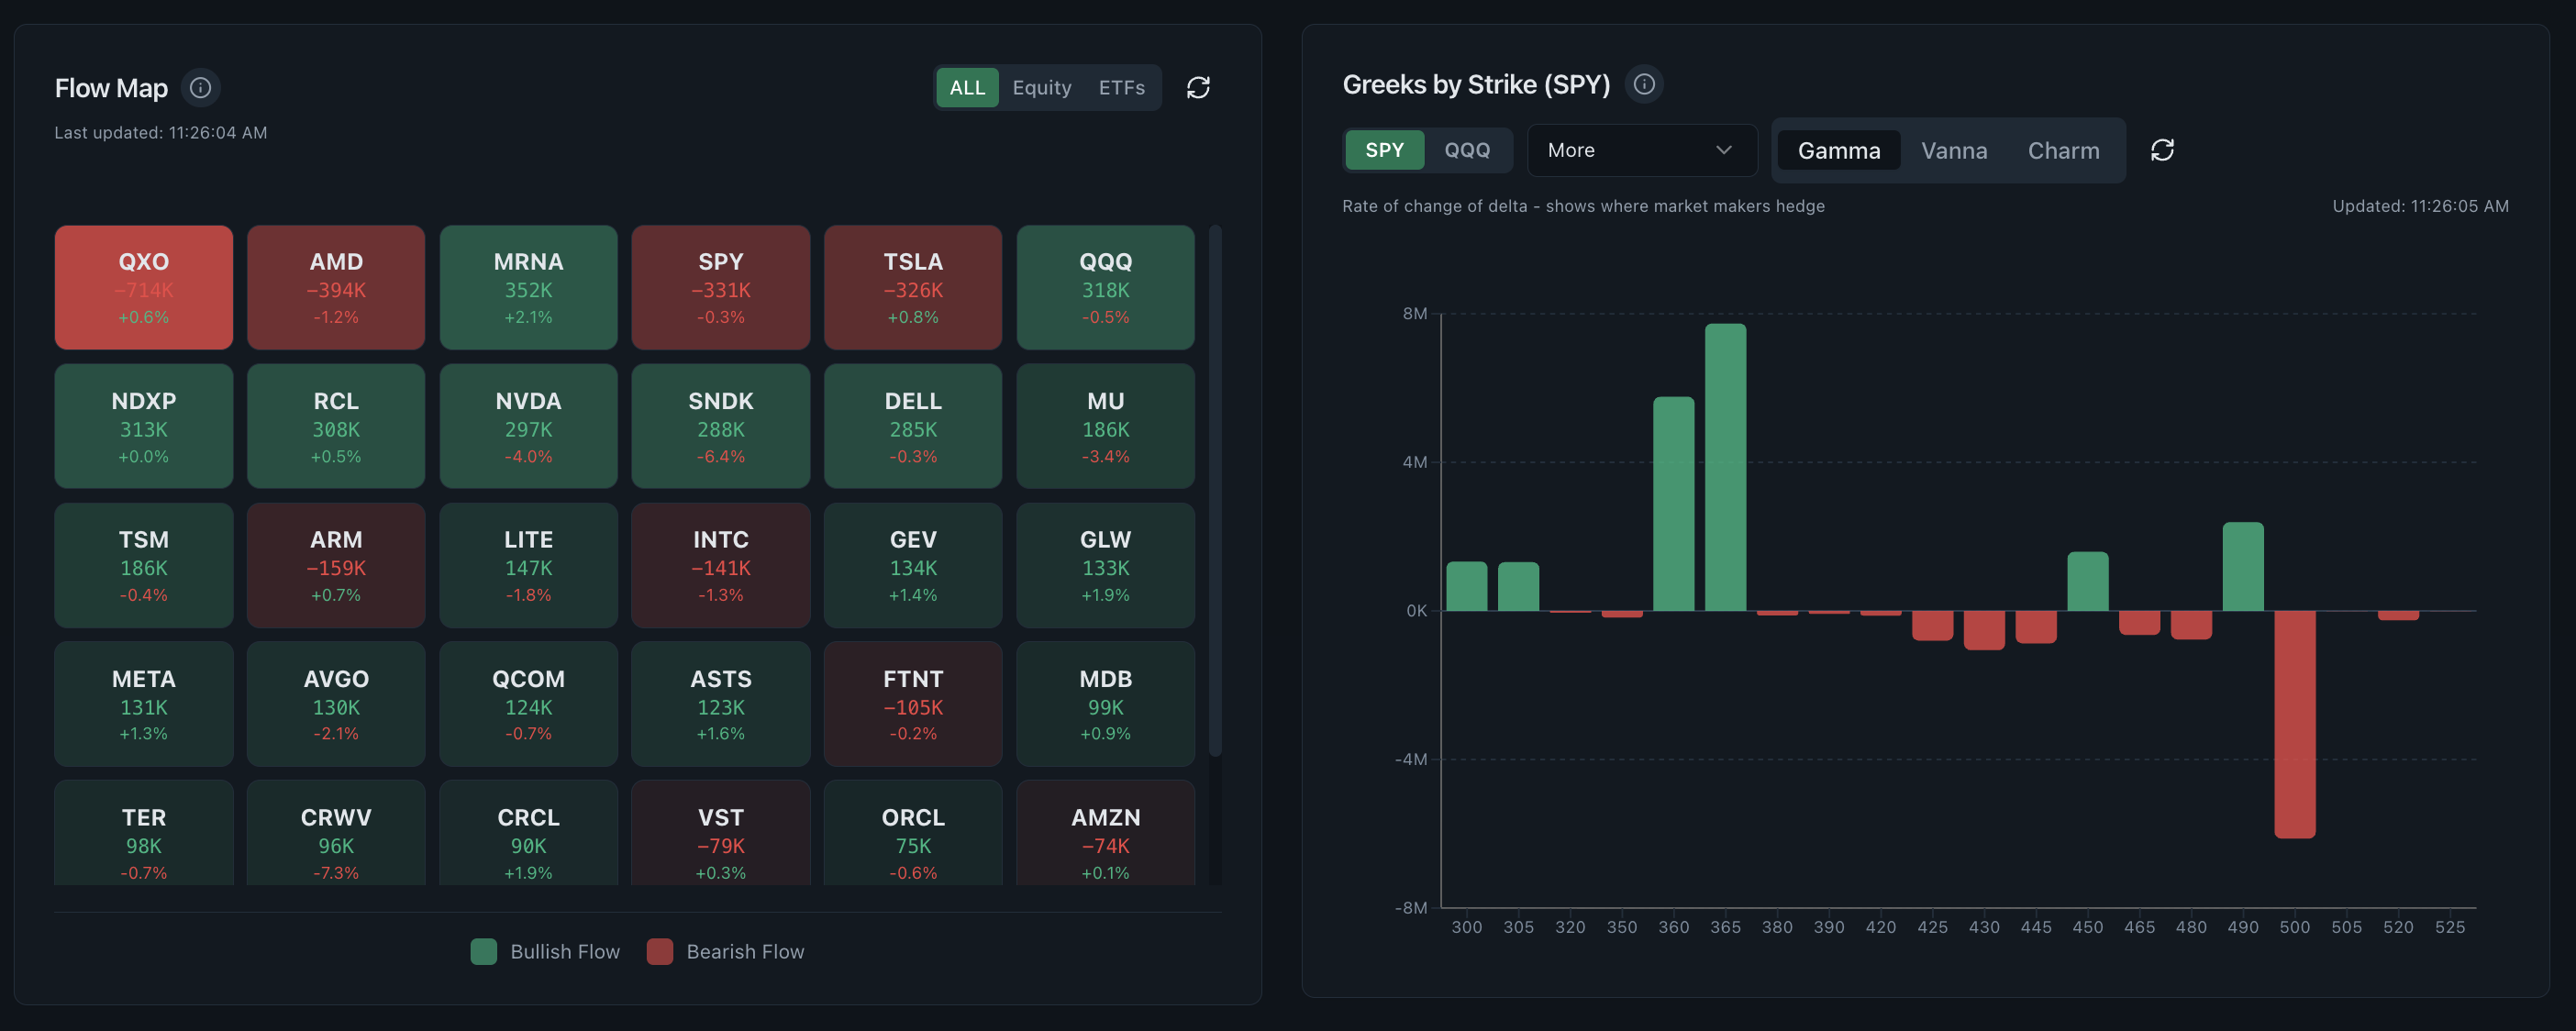
- Gamma
- Expected change in delta as the underlying moves
- Vanna
- Sensitivity involving delta and implied volatility
- Charm
- Expected change in delta as time passes
- Status
- Theoretical guideposts from pricing models
Why plot sensitivities by strike
A single aggregate Greek can hide where the exposure sits. A strike chart shows whether sensitivity is concentrated near spot, distributed across wings or clustered around one expiry-related level.
Read the supporting context
The map becomes more useful when the current price and option-flow concentration are visible at the same time.
How gamma, vanna and charm answer different questions
Gamma focuses on how delta changes with the underlying. Vanna adds the relationship with implied volatility, and charm adds the passage of time. A strike can rank differently under each measure because price, volatility and time are distinct inputs.
- Use gamma for local delta sensitivity around price changes.
- Use vanna to examine how volatility changes can alter exposure.
- Use charm to study the effect of time passing on delta.
- Use actual flow and price to decide whether a modeled concentration is currently relevant.
Model outputs need model humility
The Options Industry Council describes Greeks as theoretical guideposts. Their values change with stock price, time, implied volatility, interest rates and dividends, and aggregate exposure adds assumptions about which side holds the contracts.
Read the supporting context
A clear chart can make an estimate feel observed. Keep the distinction visible in both the page copy and the interpretation.
Common questions
What are the main options Greeks?
The commonly used Greeks include delta, gamma, theta, vega and rho. Realtime Options also visualizes vanna and charm because volatility and time can change delta exposure.
Why does gamma change by strike?
Moneyness and time to expiration affect how sensitive delta is. Near-the-money, shorter-dated options often have higher gamma than far-dated or deep in- or out-of-the-money options.
Do Greeks predict option prices exactly?
No. They estimate sensitivity under a pricing model. Actual option prices also reflect changing inputs, spreads, liquidity and market behavior.