


0DTE options and gamma exposure
Zero-days-to-expiry options expire the same session, so their sensitivity concentrates around the current price and decays through the day. Gamma exposure estimates how much hedging that positioning forces on dealers as price moves. Both are models built on assumptions, and the pages below are explicit about which assumptions.
- Pages on this topic
- 14
- Where to start
- Read the gamma exposure guide, then 0DTE mechanics, then the dashboard guides for the 0DTE GEX and magnet-level views.
- Applies to
- US-listed stock and ETF options
- Purpose
- Independent research and education
A GEX level is not a price floor
Gamma exposure is computed from open interest, an assumed dealer-positioning sign and a pricing model. Change the assumption about which side dealers are on and the chart changes shape. Levels described as magnets, pivots or flip points describe where hedging flows would mechanically concentrate if the assumptions hold, not where price is going.
Read the supporting context
0DTE adds speed to this. Same-day gamma is largest near spot and collapses as expiry approaches, so a level that mattered at 10am can be irrelevant by 3pm. Total loss on a same-day contract is the ordinary case, not the tail.
Concept guides
- Gamma exposure (GEX) explainedGamma exposure, often shortened to GEX, is an estimate of how aggregate option delta may change as the underlying price moves.
- 0DTE options and same-day positioning0DTE options have zero days remaining until expiration at the time they trade.
- Options Greeks by strikeOptions Greeks by strike group model-derived sensitivities at each exercise price so a researcher can see where delta may respond to price, volatility and time.
Screens, tools and comparisons
Dashboard guides
- Premium Heat Grid dashboardThe Premium Heat Grid maps call and put premium, gamma exposure and vanna exposure across strike and expiry.
- Flow Map and Greeks by Strike dashboardThe Flow Map ranks bullish and bearish ticker activity while the adjacent strike chart plots gamma, vanna and charm.
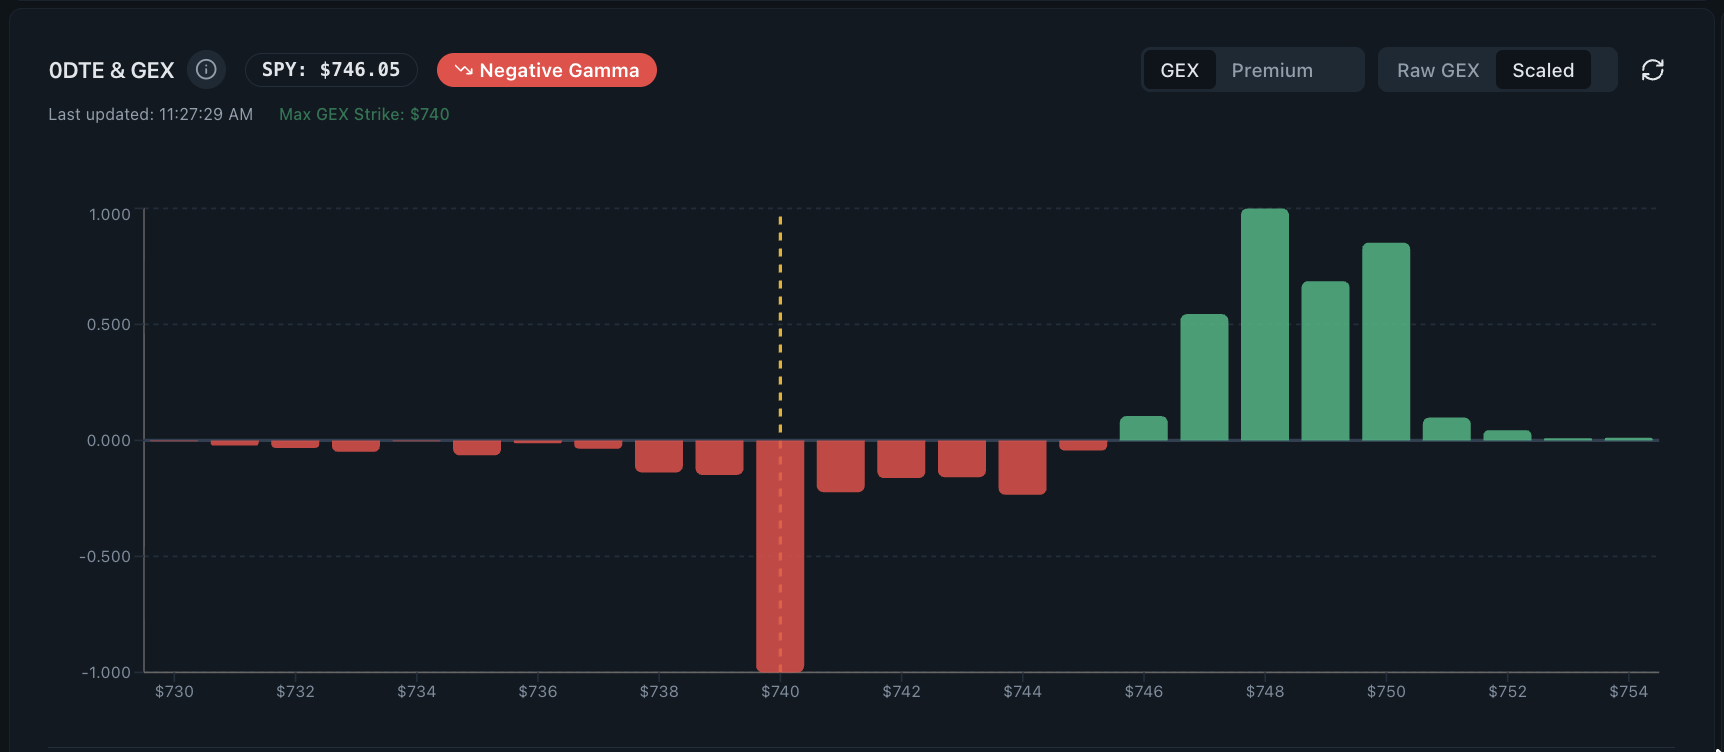
- 0DTE and GEX dashboardThe 0DTE and GEX dashboard plots estimated same-day gamma exposure by strike around the current price.
- Open Interest Heatmap ToolThe Realtime Options Open Interest Heatmap is an interactive strike-by-expiry grid for inspecting where one symbol's outstanding contracts are concentrated.
- Magnet Levels dealer-gamma viewMagnet Levels ranks strikes using a flow-signed estimate of dealer gamma and labels call walls, put walls, modeled magnets and the gamma-flip area around spot.
Applied workflows and method posts
- Day trading options flow: an intraday research routineAn intraday options flow routine divides the session into four windows: pre-open context, the opening 30 minutes, midday and the closing hour.
- 0DTE options research: same-day gamma and same-day risk0DTE options research studies contracts expiring the same trading day, where gamma concentrates tightly around the current price and the entire position resolves within hours.
- SPY and QQQ options flow: index context before single namesSPY and QQQ options flow reads differently from single-stock flow because a large share of it is hedging rather than speculation, same-day expiries take a much larger share of volume, there is no company-specific catalyst, and dealer positioning in these products is unusually concentrated.
- How to read a week of SPY options flowReading a week of SPY options flow means separating the fields that reset every session from the ones that accumulate across the week.
- What the 0DTE share of volume actually meansThe 0DTE share of volume is the proportion of options contracts traded in a period that expire the same day.
Common questions
Is gamma exposure data or a model?
It is a model. Open interest, strikes, expiries and price are observed inputs. The dealer-positioning sign is assumed, and vendors make different assumptions, so GEX charts can disagree.
Why does 0DTE positioning change so fast?
Gamma rises sharply as an option approaches expiry near the money and collapses once it is clearly in or out of the money. On a same-day contract that whole arc happens inside one session, so the exposure map is rebuilt continuously.