By Realtime Options ResearchUpdated

Options flow tools and dashboard guides

Realtime Options combines ten core options-research dashboards with eight specialist views for volume change, cleared open interest, swing structure, contract evidence, implied movement, modeled gamma levels, intraday confirmation and historical review. The 18 guides show real product screens, use cases, reading steps, benefits and interpretation limits without treating any score, color or level as a signal.

Tool guides
18: ten core dashboards plus eight specialist views
Screenshots
20 captures from the working product
Coverage
US-listed stock and ETF options
Purpose
Independent research and education
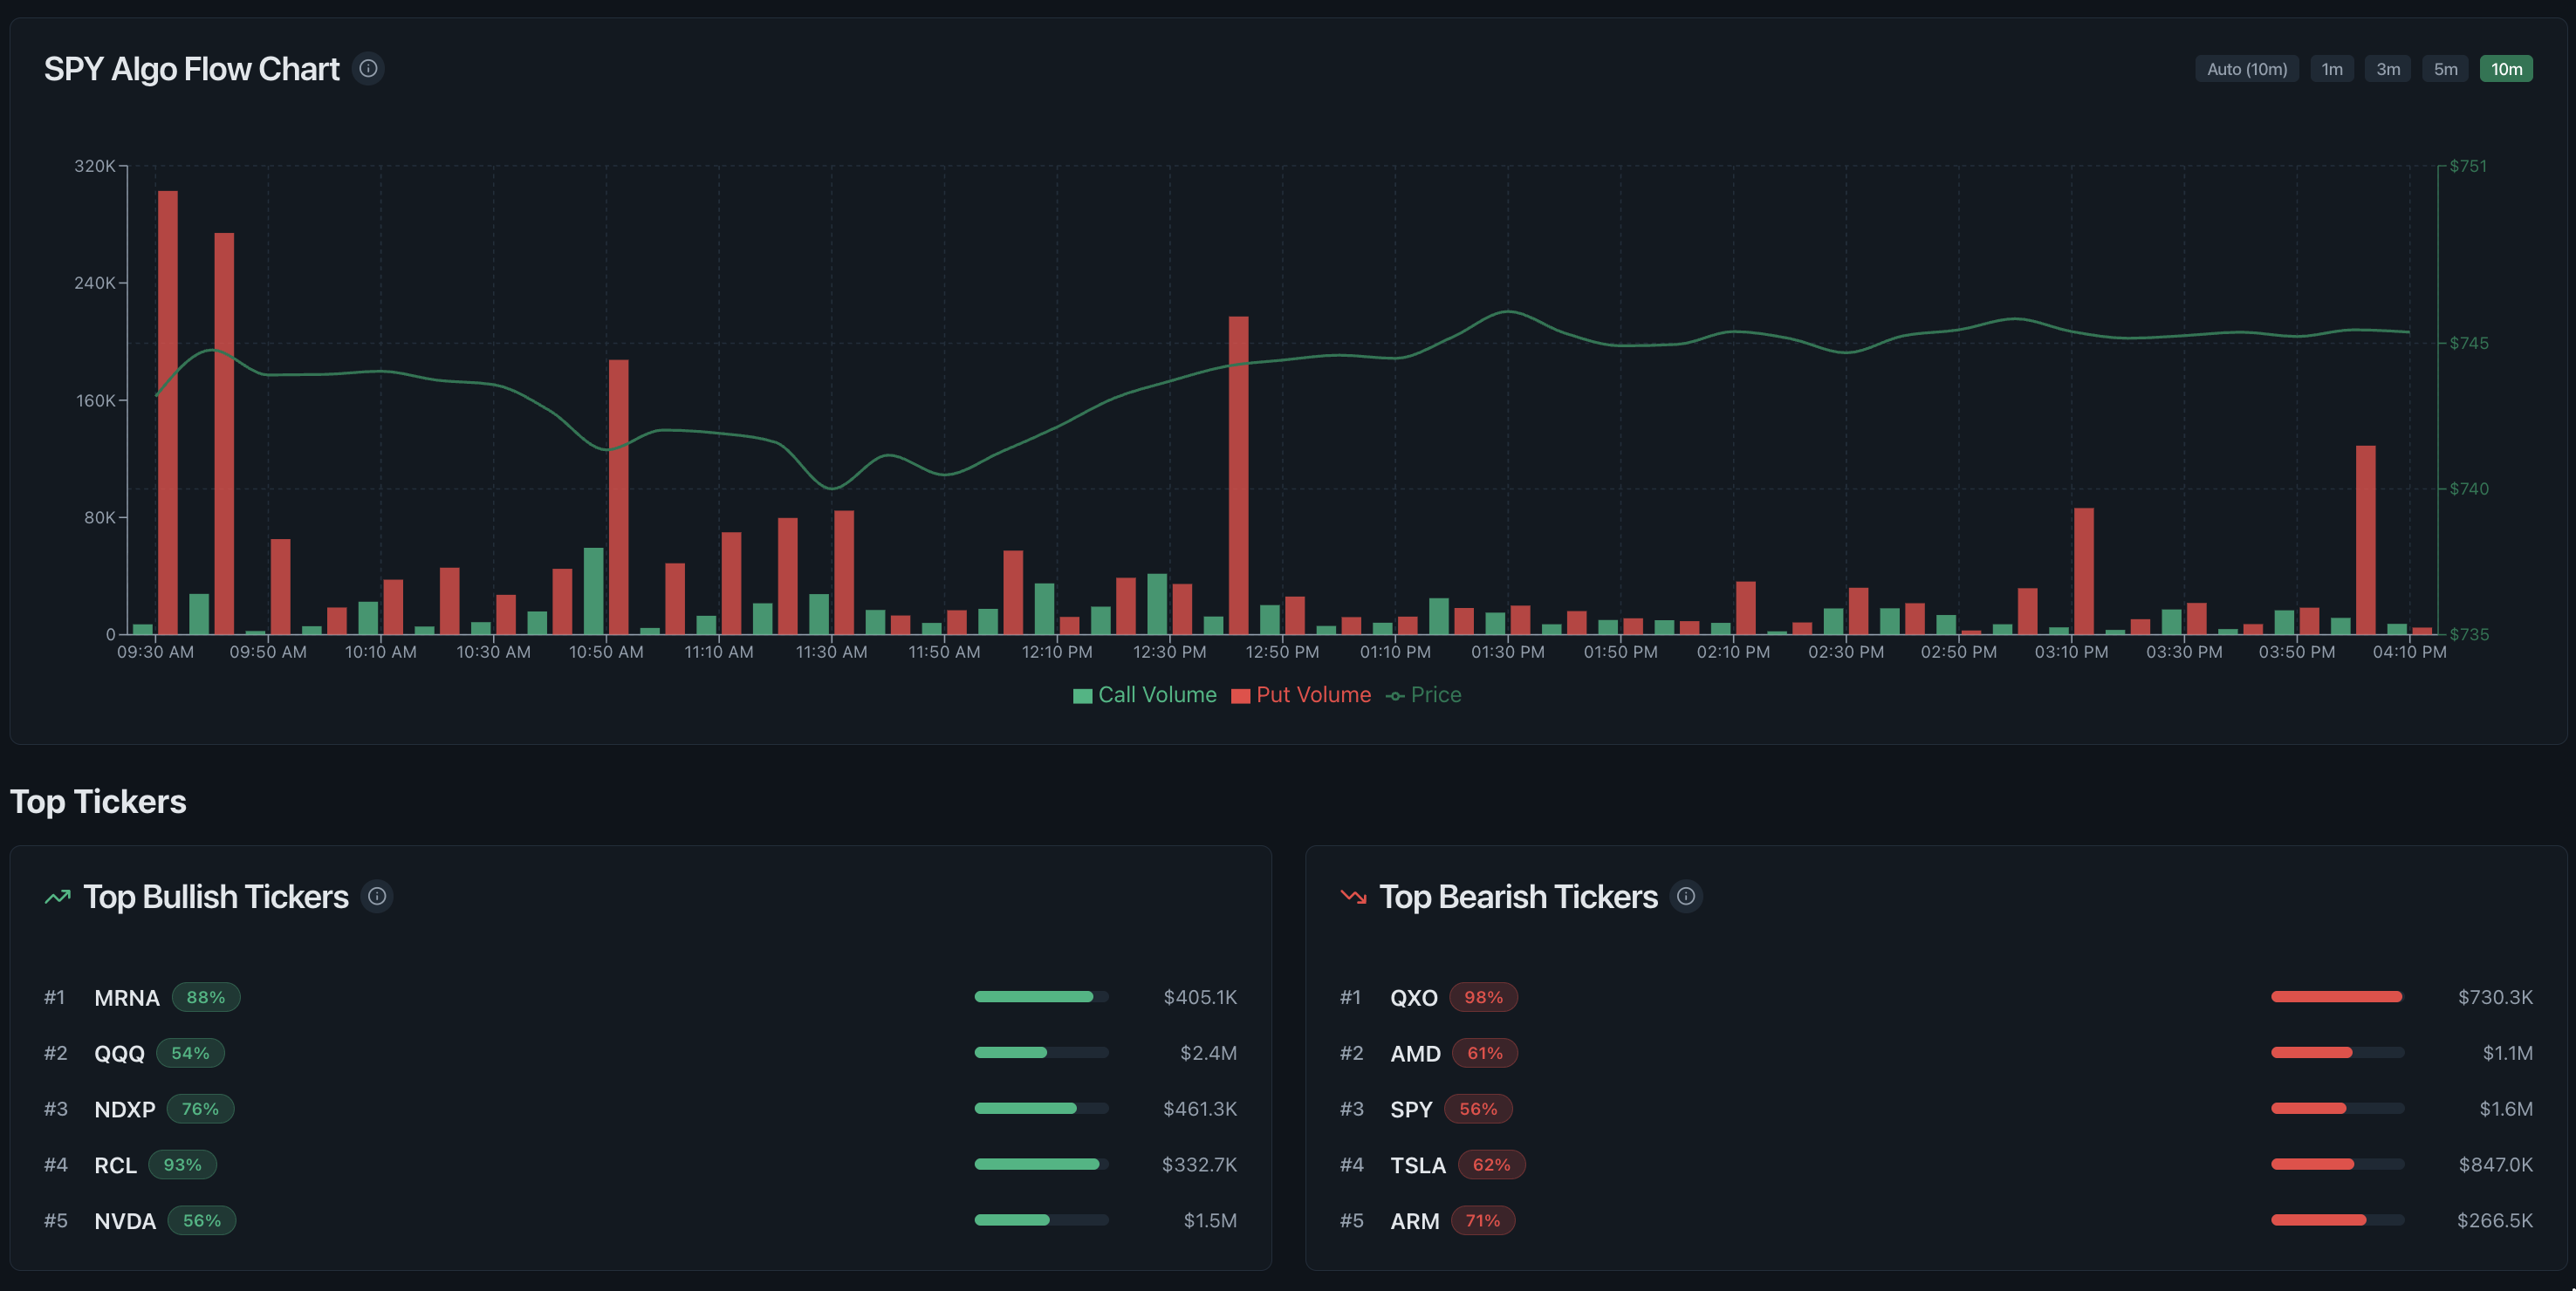
Realtime Options dashboard with options flow chart and top ticker rankings
One of ten core product dashboards documented alongside eight specialist research views.

Start with market-wide direction

Weighted Net Flow, Sector and Ticker Flow, and Algo Flow answer the broadest questions first: which side is absorbing premium and which areas of the market carry that activity. This is the stage for building a research list, not choosing a contract.

  • Weighted Net Flow: calls, puts, sentiment and price on one session chart.
  • Sector and Ticker Flow: market breadth narrowed to active groups and names.
  • Algo Flow and Top Tickers: volume bursts beside ranked bullish and bearish activity.

Move from ticker to strike and expiry

Flow Map, Premium Heat Grid, 0DTE GEX, and Premium with Open Interest explain where the activity sits in the option chain and how exposure changes around spot.

  • Flow Map and Greeks by Strike: ranked tickers beside gamma, vanna and charm.
  • Premium Heat Grid: premium and exposures across strikes and expiries.
  • 0DTE and GEX: same-day gamma concentration around the current price.
  • Premium Heatmap and Open Interest: fresh premium above existing positioning.

Finish with history and catalyst context

Whales Positioning, Flow Trend and Market News are the verification layer. They show how one contract developed, whether the session differs from recent history and what reported event may explain the activity.

  • Whales Positioning: ask-, mid- and bid-side premium with contract history.
  • Flow Trend: premium, volume, put/call ratio and trade count across sessions.
  • Market News Context: ticker-filtered headlines and timestamps.

Extend the workflow with specialist research views

The specialist layer adds eight narrower jobs without changing the research-first product boundary. Volume Change and Conviction Radar prioritise what to inspect; Open Interest Lens, Premium Edge and Magnet Levels expose specific positioning and model questions; Underlying Pulse, Swing Contract Compass and Historical Flow Analysis test the idea across price and time.

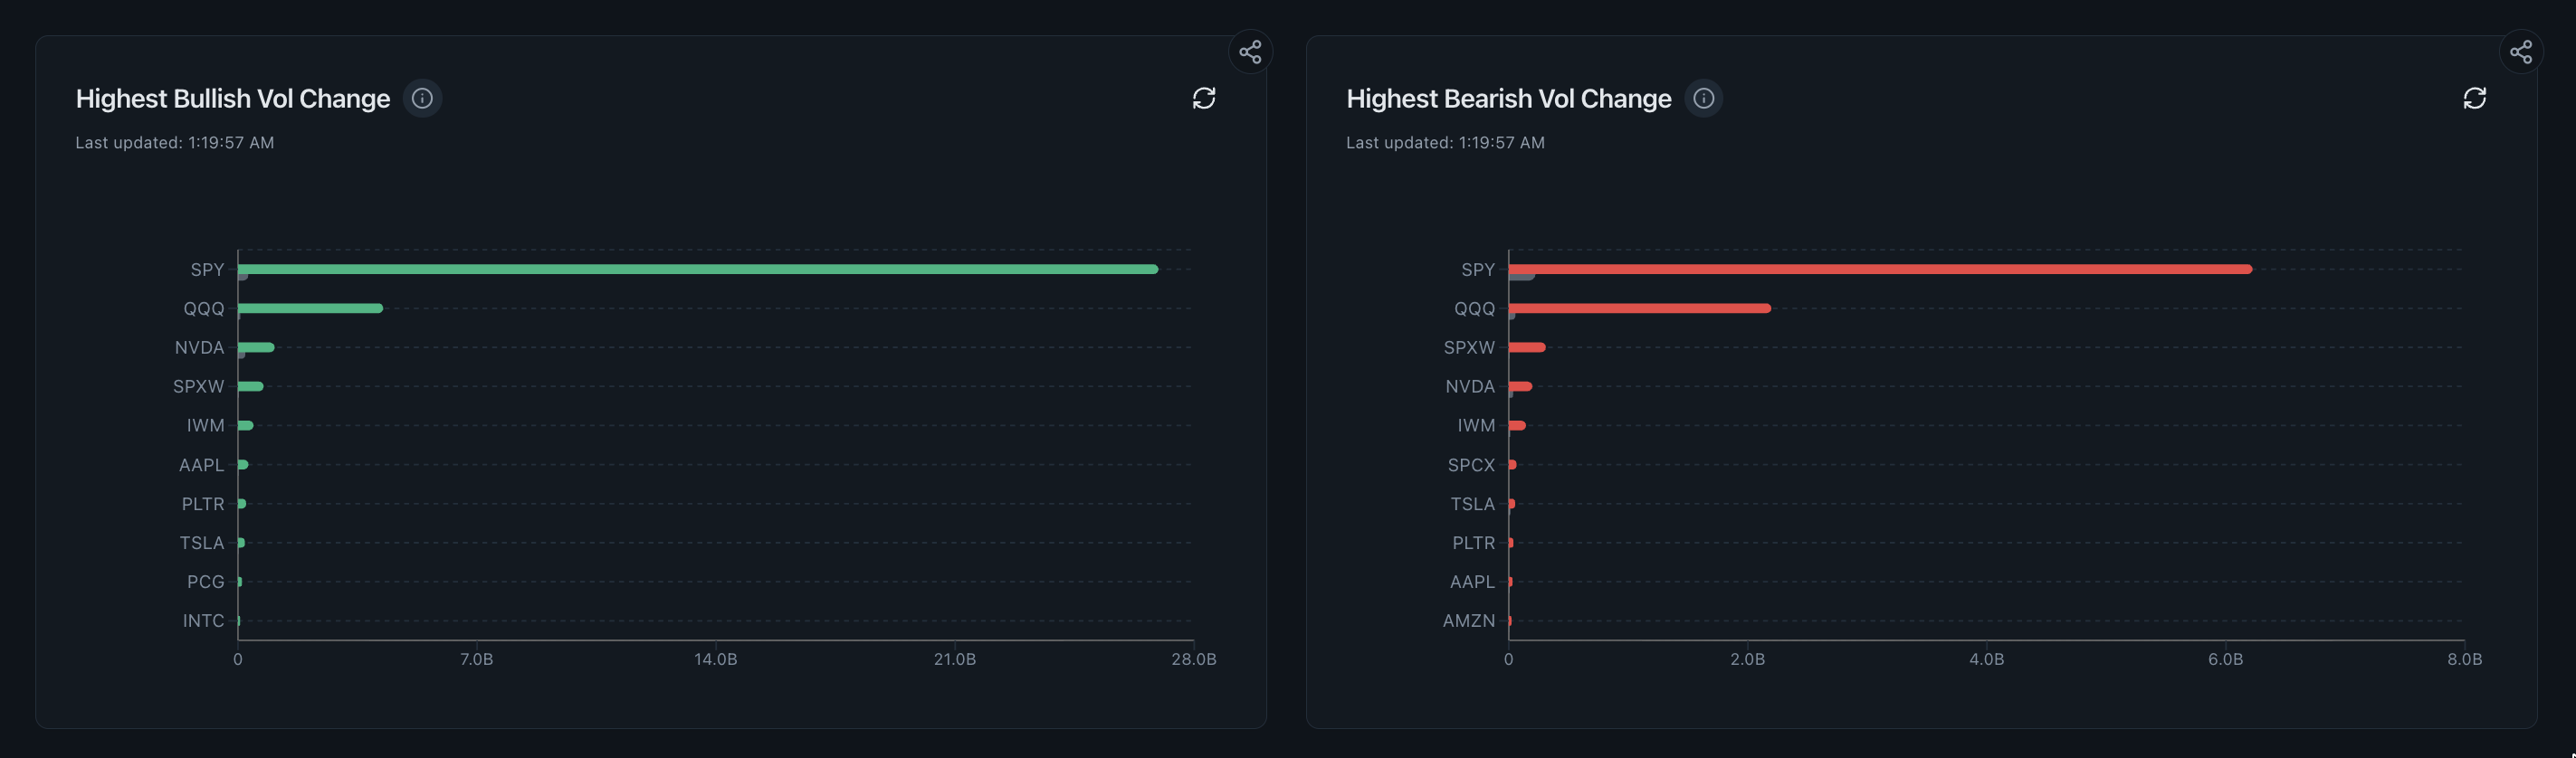
  • Bullish and Bearish Volume Change: market-wide watchlist discovery.
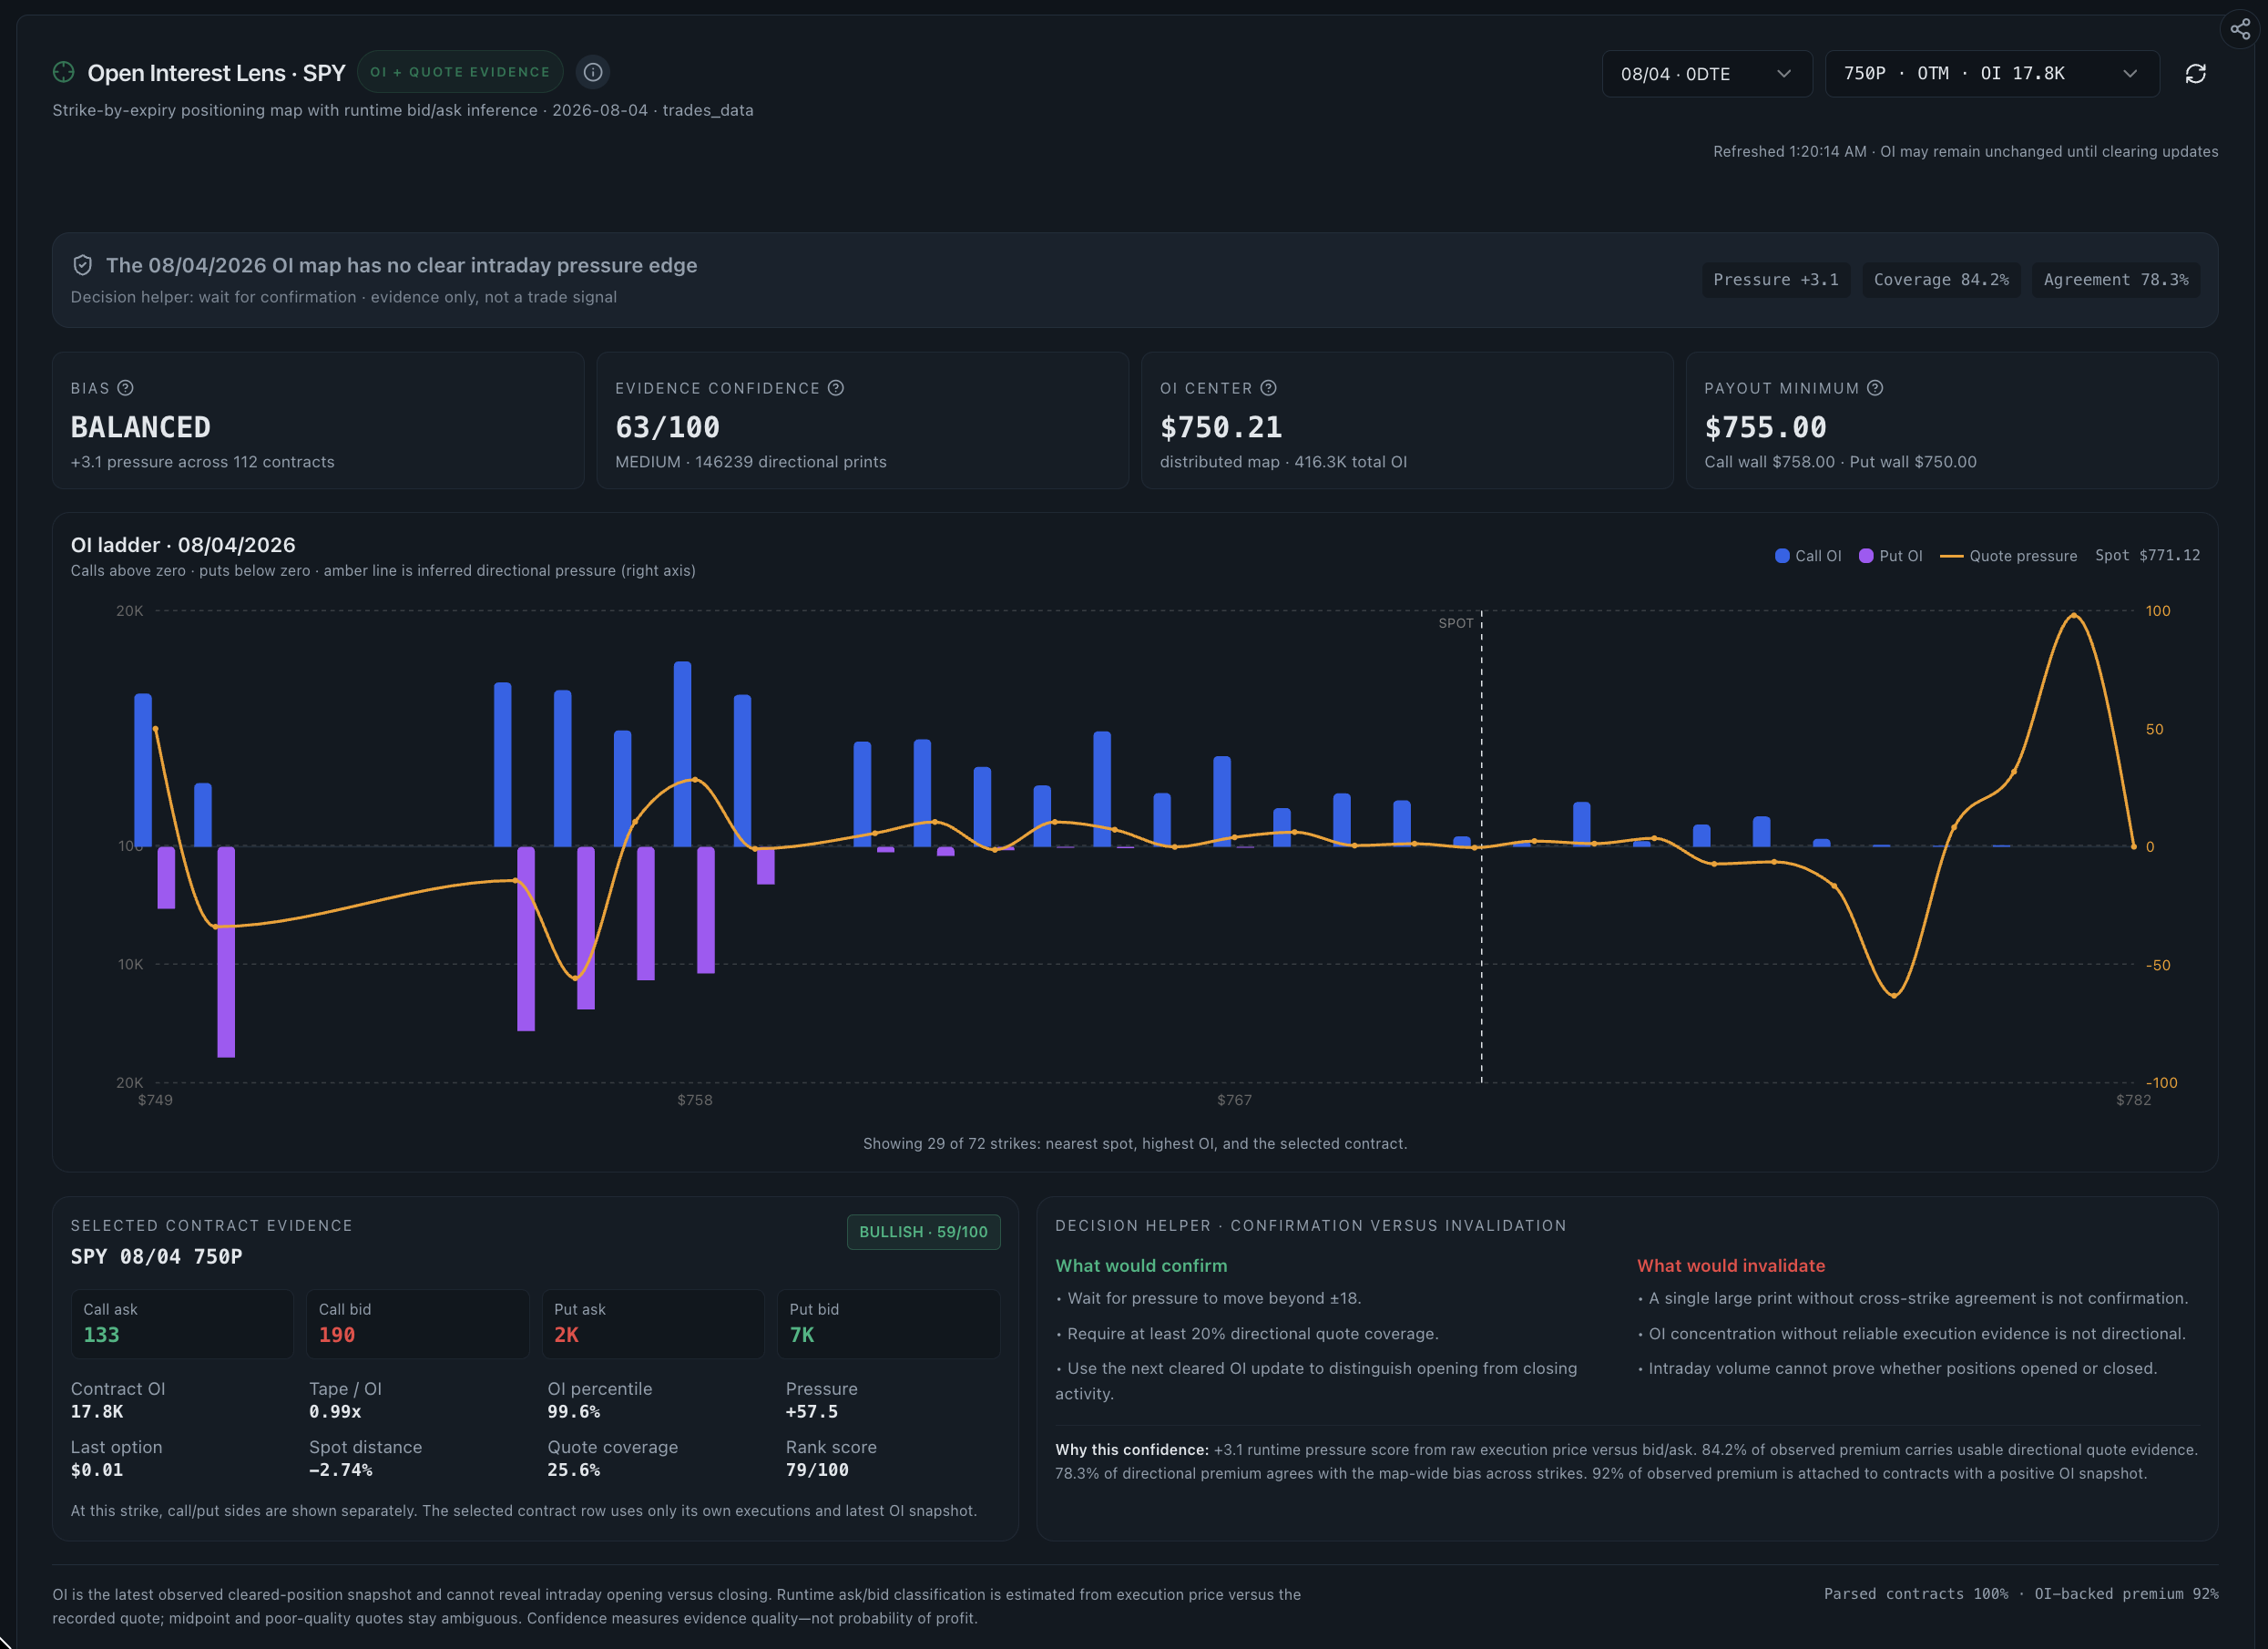
  • Open Interest Lens: cleared strike positioning beside runtime quote evidence.
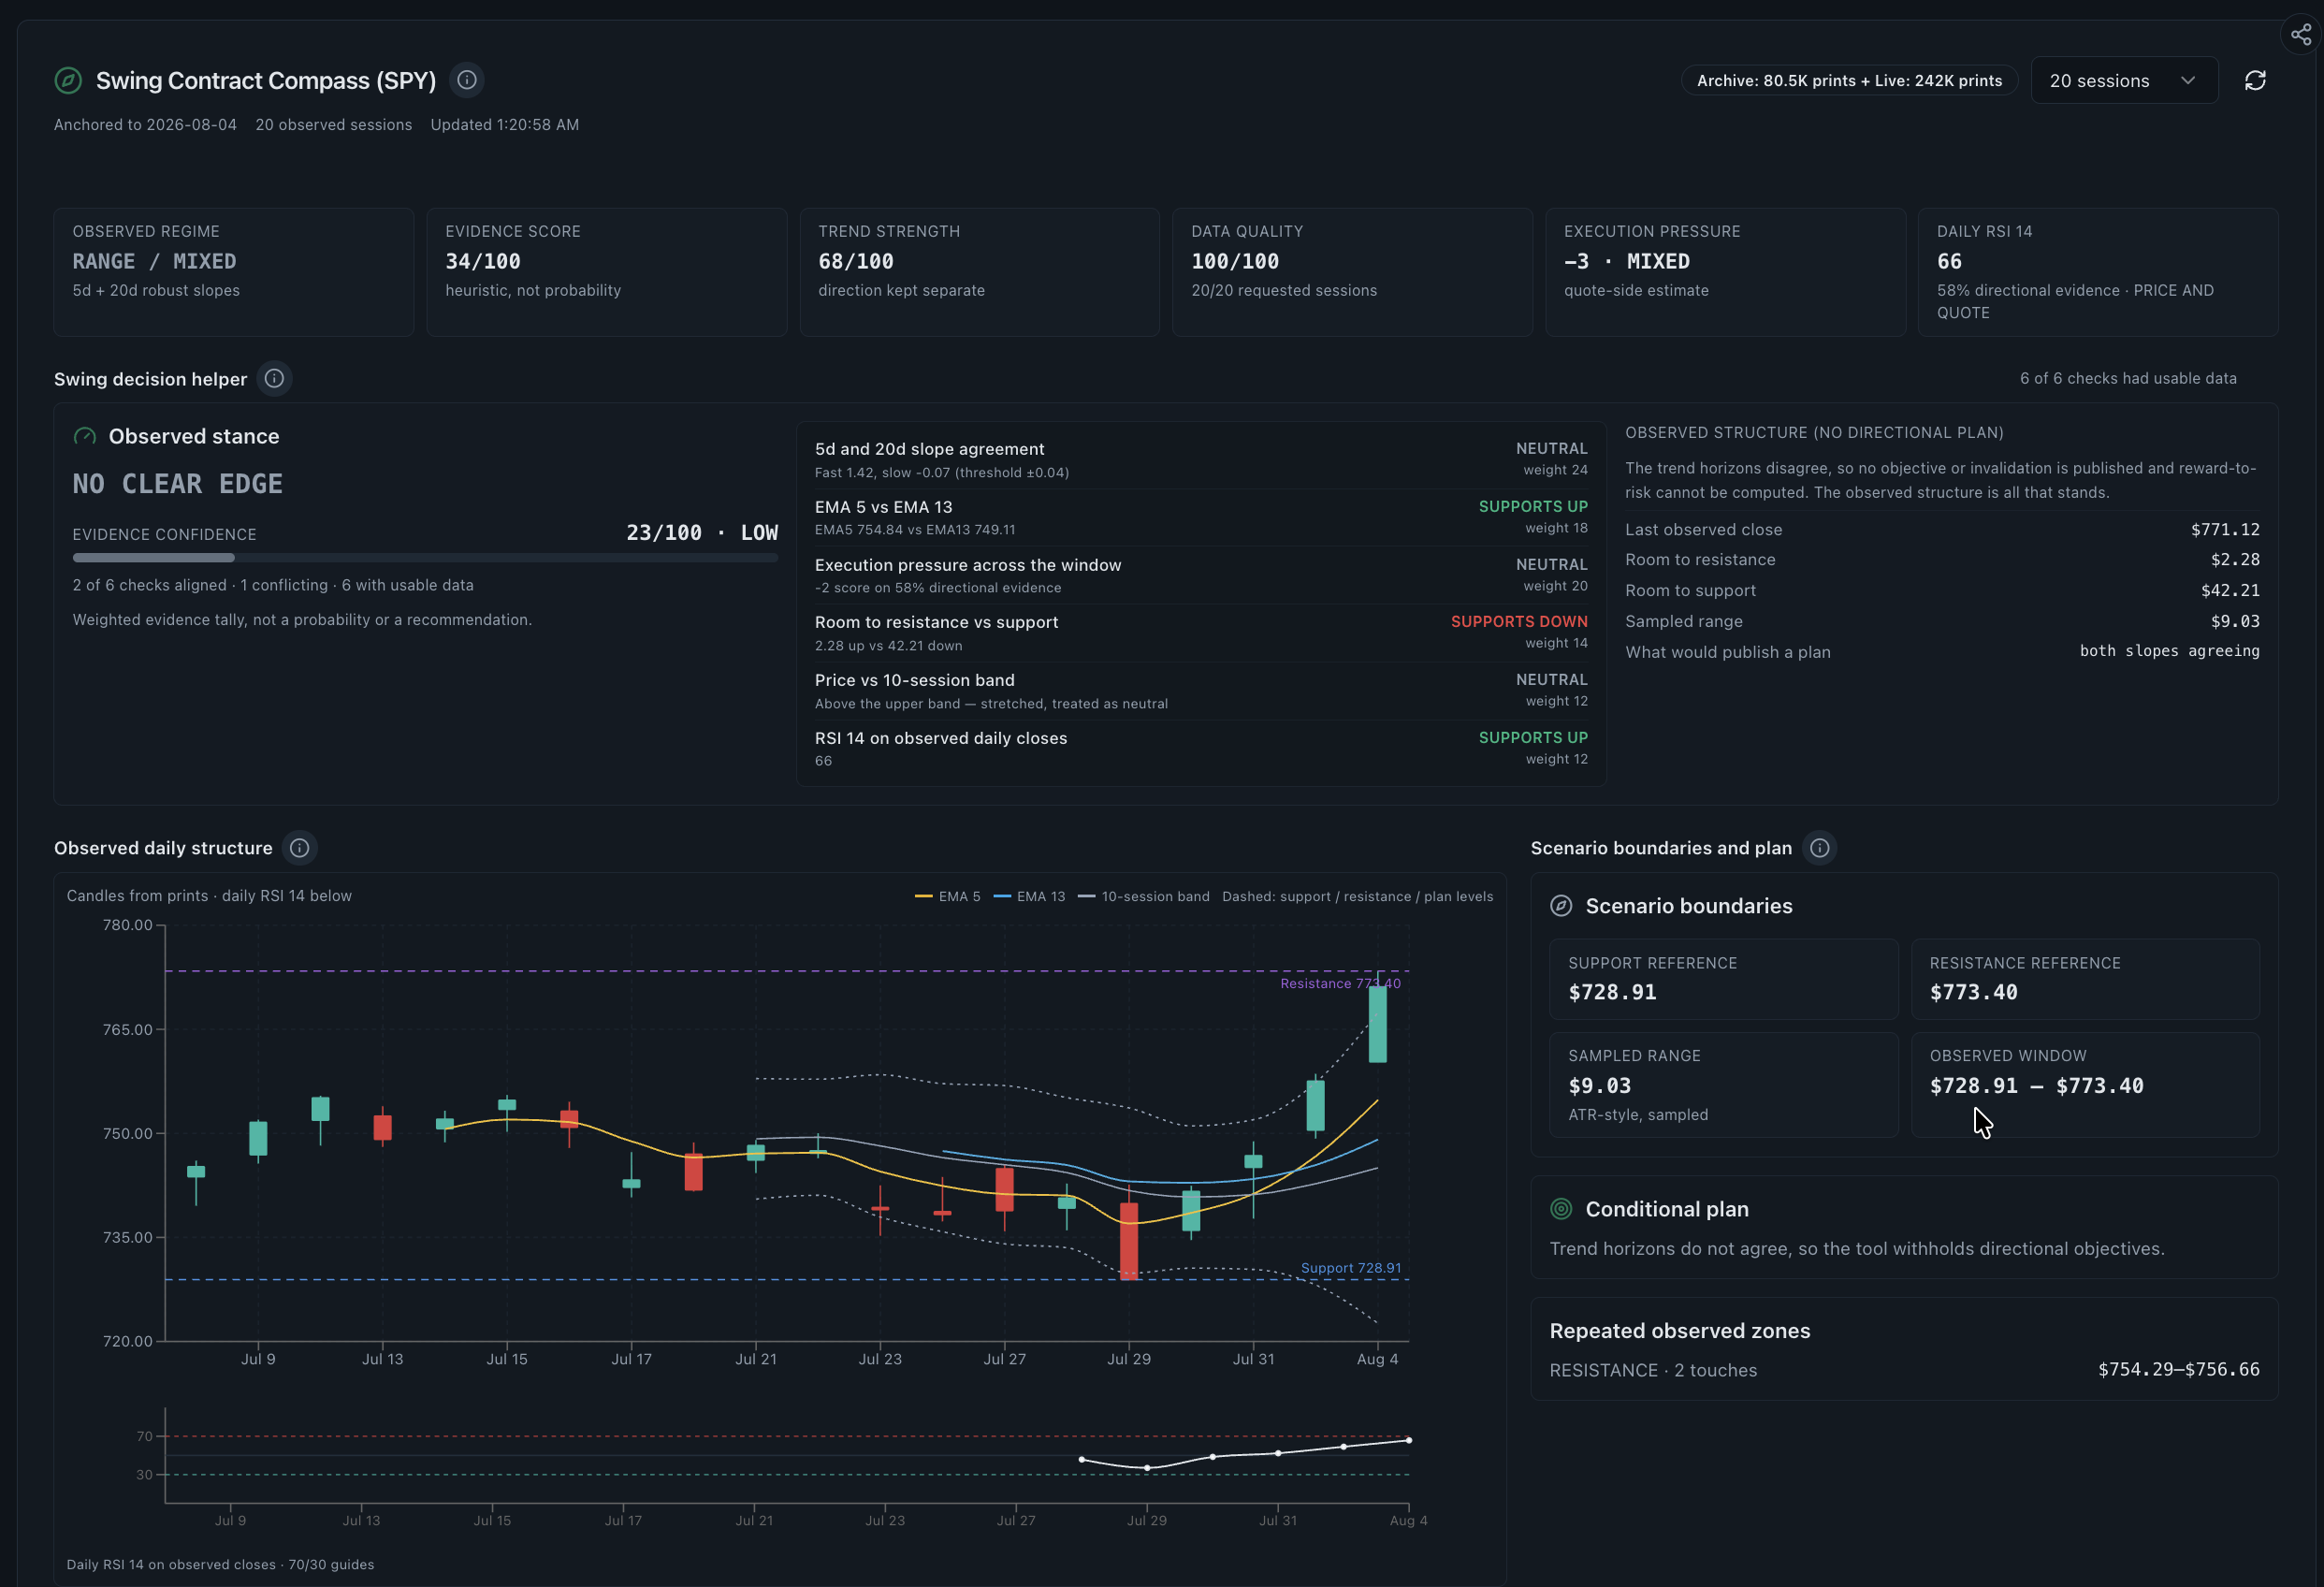
  • Swing Contract Compass: multi-session evidence with no-plan states when checks conflict.
  • Conviction Radar: contract triage with explicit historical evidence status.
  • Premium Edge: priced movement versus a disclosed historical sample.
  • Magnet Levels: modeled dealer-gamma references around spot.
  • Underlying Pulse: intraday price, VWAP, pressure and participation on one clock.
  • Historical Flow Analysis: premium, volume, trades and breadth across periods.

Questions people ask about this

Which options flow tool should I open first?

Start with Weighted Net Flow for the market-wide backdrop. Narrow with sector and ticker rankings, then use strike, expiry, open-interest and contract-history tools to test the names that remain.

Are these actual product screenshots?

Yes. Every tool guide uses a screenshot captured from the working Realtime Options product rather than a generated interface or design mockup.

Do the tools provide trading signals?

No. They organize observed market data and derived analytics. There are no buy or sell calls, automated orders or promised outcomes.

Realtime Options is a data analytics and visualisation platform. It does not provide financial advice or trading recommendations, and it is not a registered investment advisor or broker-dealer. Options trading involves substantial risk of loss and is not suitable for all investors.

10 additional product screenshots

Eight specialist research views, shown with their limits

Use these views after the core market, ticker and strike dashboards. Each one has a specific research job, an explicit benefit and a boundary that prevents an observed score or level from being presented as a trade call.

These 10 product screenshots are historical interface examples captured on August 5, 2026. Prices, scores, labels and levels change with the selected market data. On-screen bullish, bearish, buy, sell, conviction, edge, magnet, support and resistance wording describes model classifications or scenario references—not trading instructions, personalised advice or promised outcomes.

Highest bullish and bearish options volume change rankings across SPY QQQ and active tickers
Actual Bullish and Bearish Volume Change screen captured on August 5, 2026. Rankings and values are a historical interface example, not a current signal. Open the image for the full-resolution chart labels.

Market-wide scanner

Bullish and Bearish Volume Change

Side-by-side rankings surface the symbols with the largest classified bullish and bearish change in options volume during the selected window.

Use case
Start a busy-session watchlist by finding where options participation changed before opening a ticker, contract or news view.
Research benefit
Replaces a manual market-wide scan with a short, ordered research queue that can be checked against price, premium, open interest and catalysts.
Research boundary
Bullish and bearish are model classifications of observed activity. Volume change does not prove beneficial ownership, opening versus closing, trade intent or future direction.
Read the complete Bullish and Bearish Volume Change guide
Open Interest Lens for SPY with call and put open interest ladder quote pressure and contract evidence
Actual Open Interest Lens screen captured on August 5, 2026 with a historical SPY example. Scores describe evidence quality, not expected returns. Open the image for the full-resolution chart labels.

Strike and expiry positioning

Open Interest Lens

A strike-by-expiry map places cleared call and put open interest beside estimated quote pressure, coverage, agreement and selected-contract evidence.

Use case
Investigate whether current executions line up with existing strike concentration and write down what would confirm or invalidate the interpretation.
Research benefit
Keeps daily open interest and intraday flow in one evidence trail without presenting open interest as live positioning or a directional answer.
Research boundary
Open interest is a cleared daily snapshot and cannot reveal intraday opening versus closing. Confidence measures evidence quality, not the probability of profit.
Read the complete Open Interest Lens guide
Swing Contract Compass for SPY with observed regime evidence checks price structure RSI and scenario boundaries
Swing Contract Compass overview captured on August 5, 2026. The historical example shows a no-clear-edge state rather than manufacturing a directional plan. Open the image for the full-resolution chart labels.
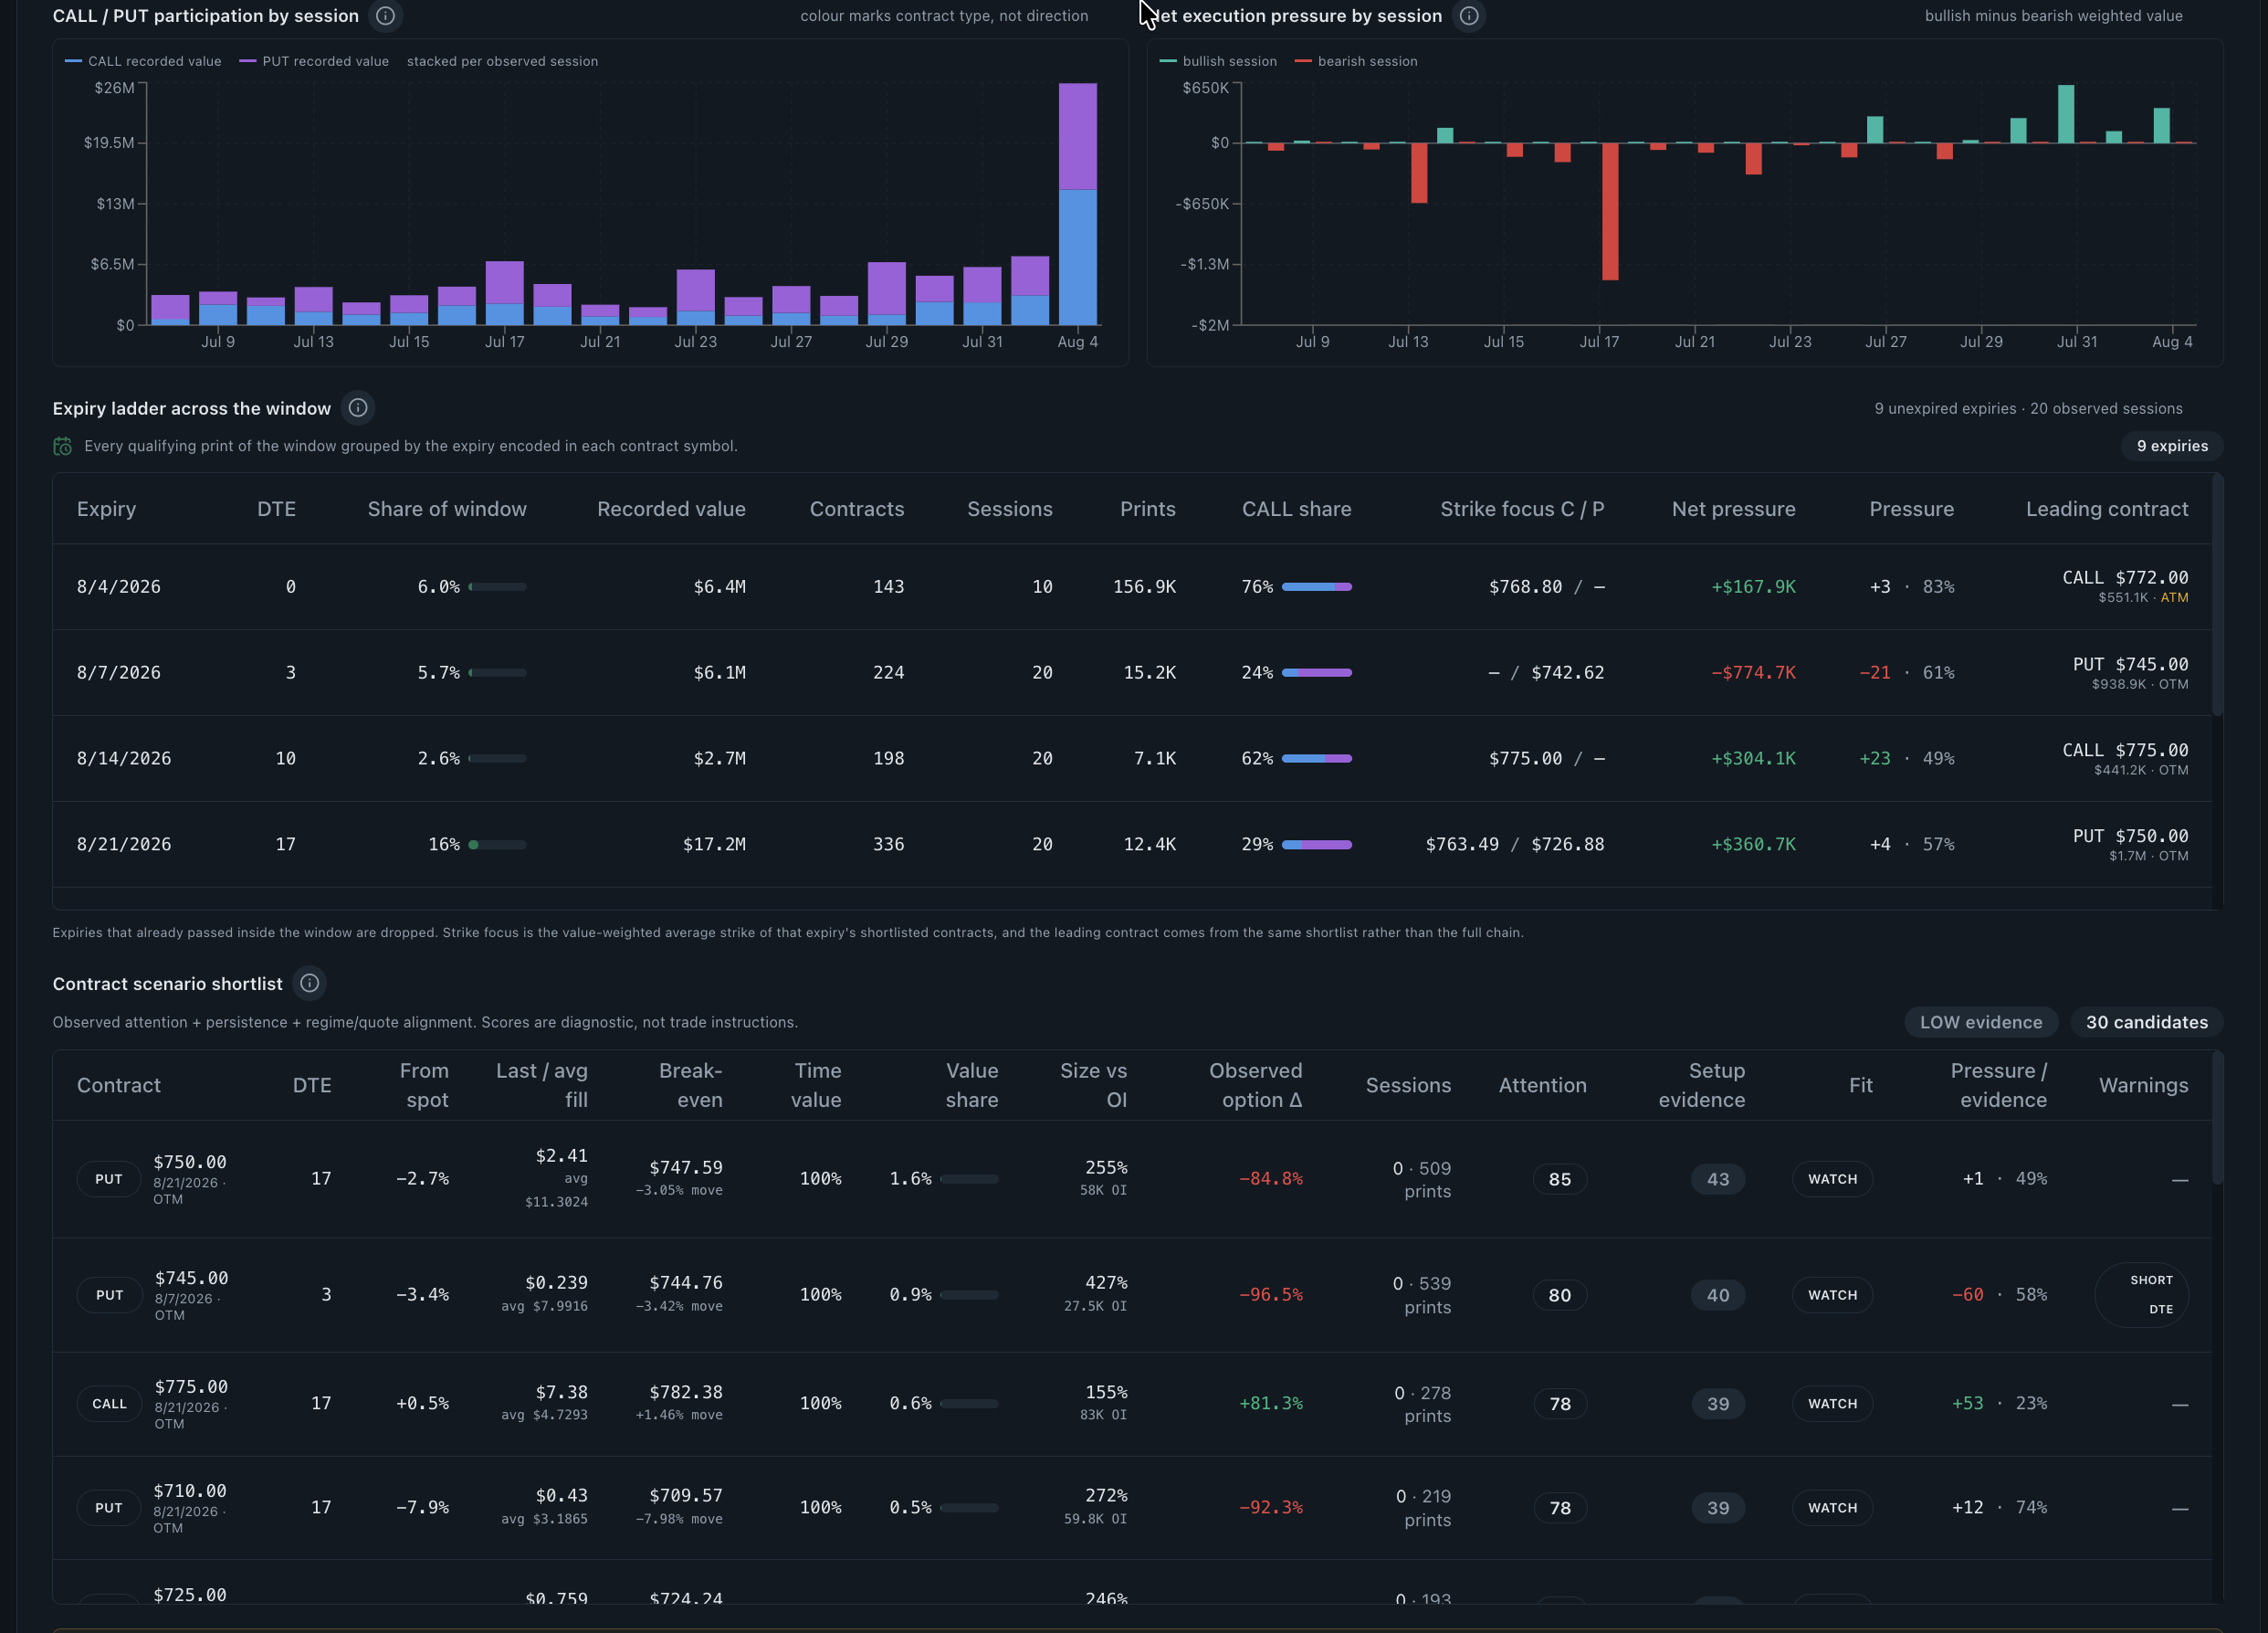
Swing Contract Compass session participation expiry ladder and contract scenario shortlist
The same historical Compass review continued into session participation, expiry concentration and a diagnostic contract shortlist. Open the image for the full-resolution chart labels.

Multi-session scenario research

Swing Contract Compass

A multi-session workspace connects observed price structure and execution pressure with expiry participation, contract persistence and explicit scenario boundaries.

Use case
Review whether a ticker and contract remain relevant across several sessions and document support, resistance, confirmation and invalidation references.
Research benefit
Turns a scattered swing review into a repeatable evidence checklist and visibly withholds a directional plan when the model's horizons disagree.
Research boundary
Scores, support and resistance references are heuristic observations. They are not objectives, entries, exits, position sizing or personalised recommendations.
Read the complete Swing Contract Compass guide
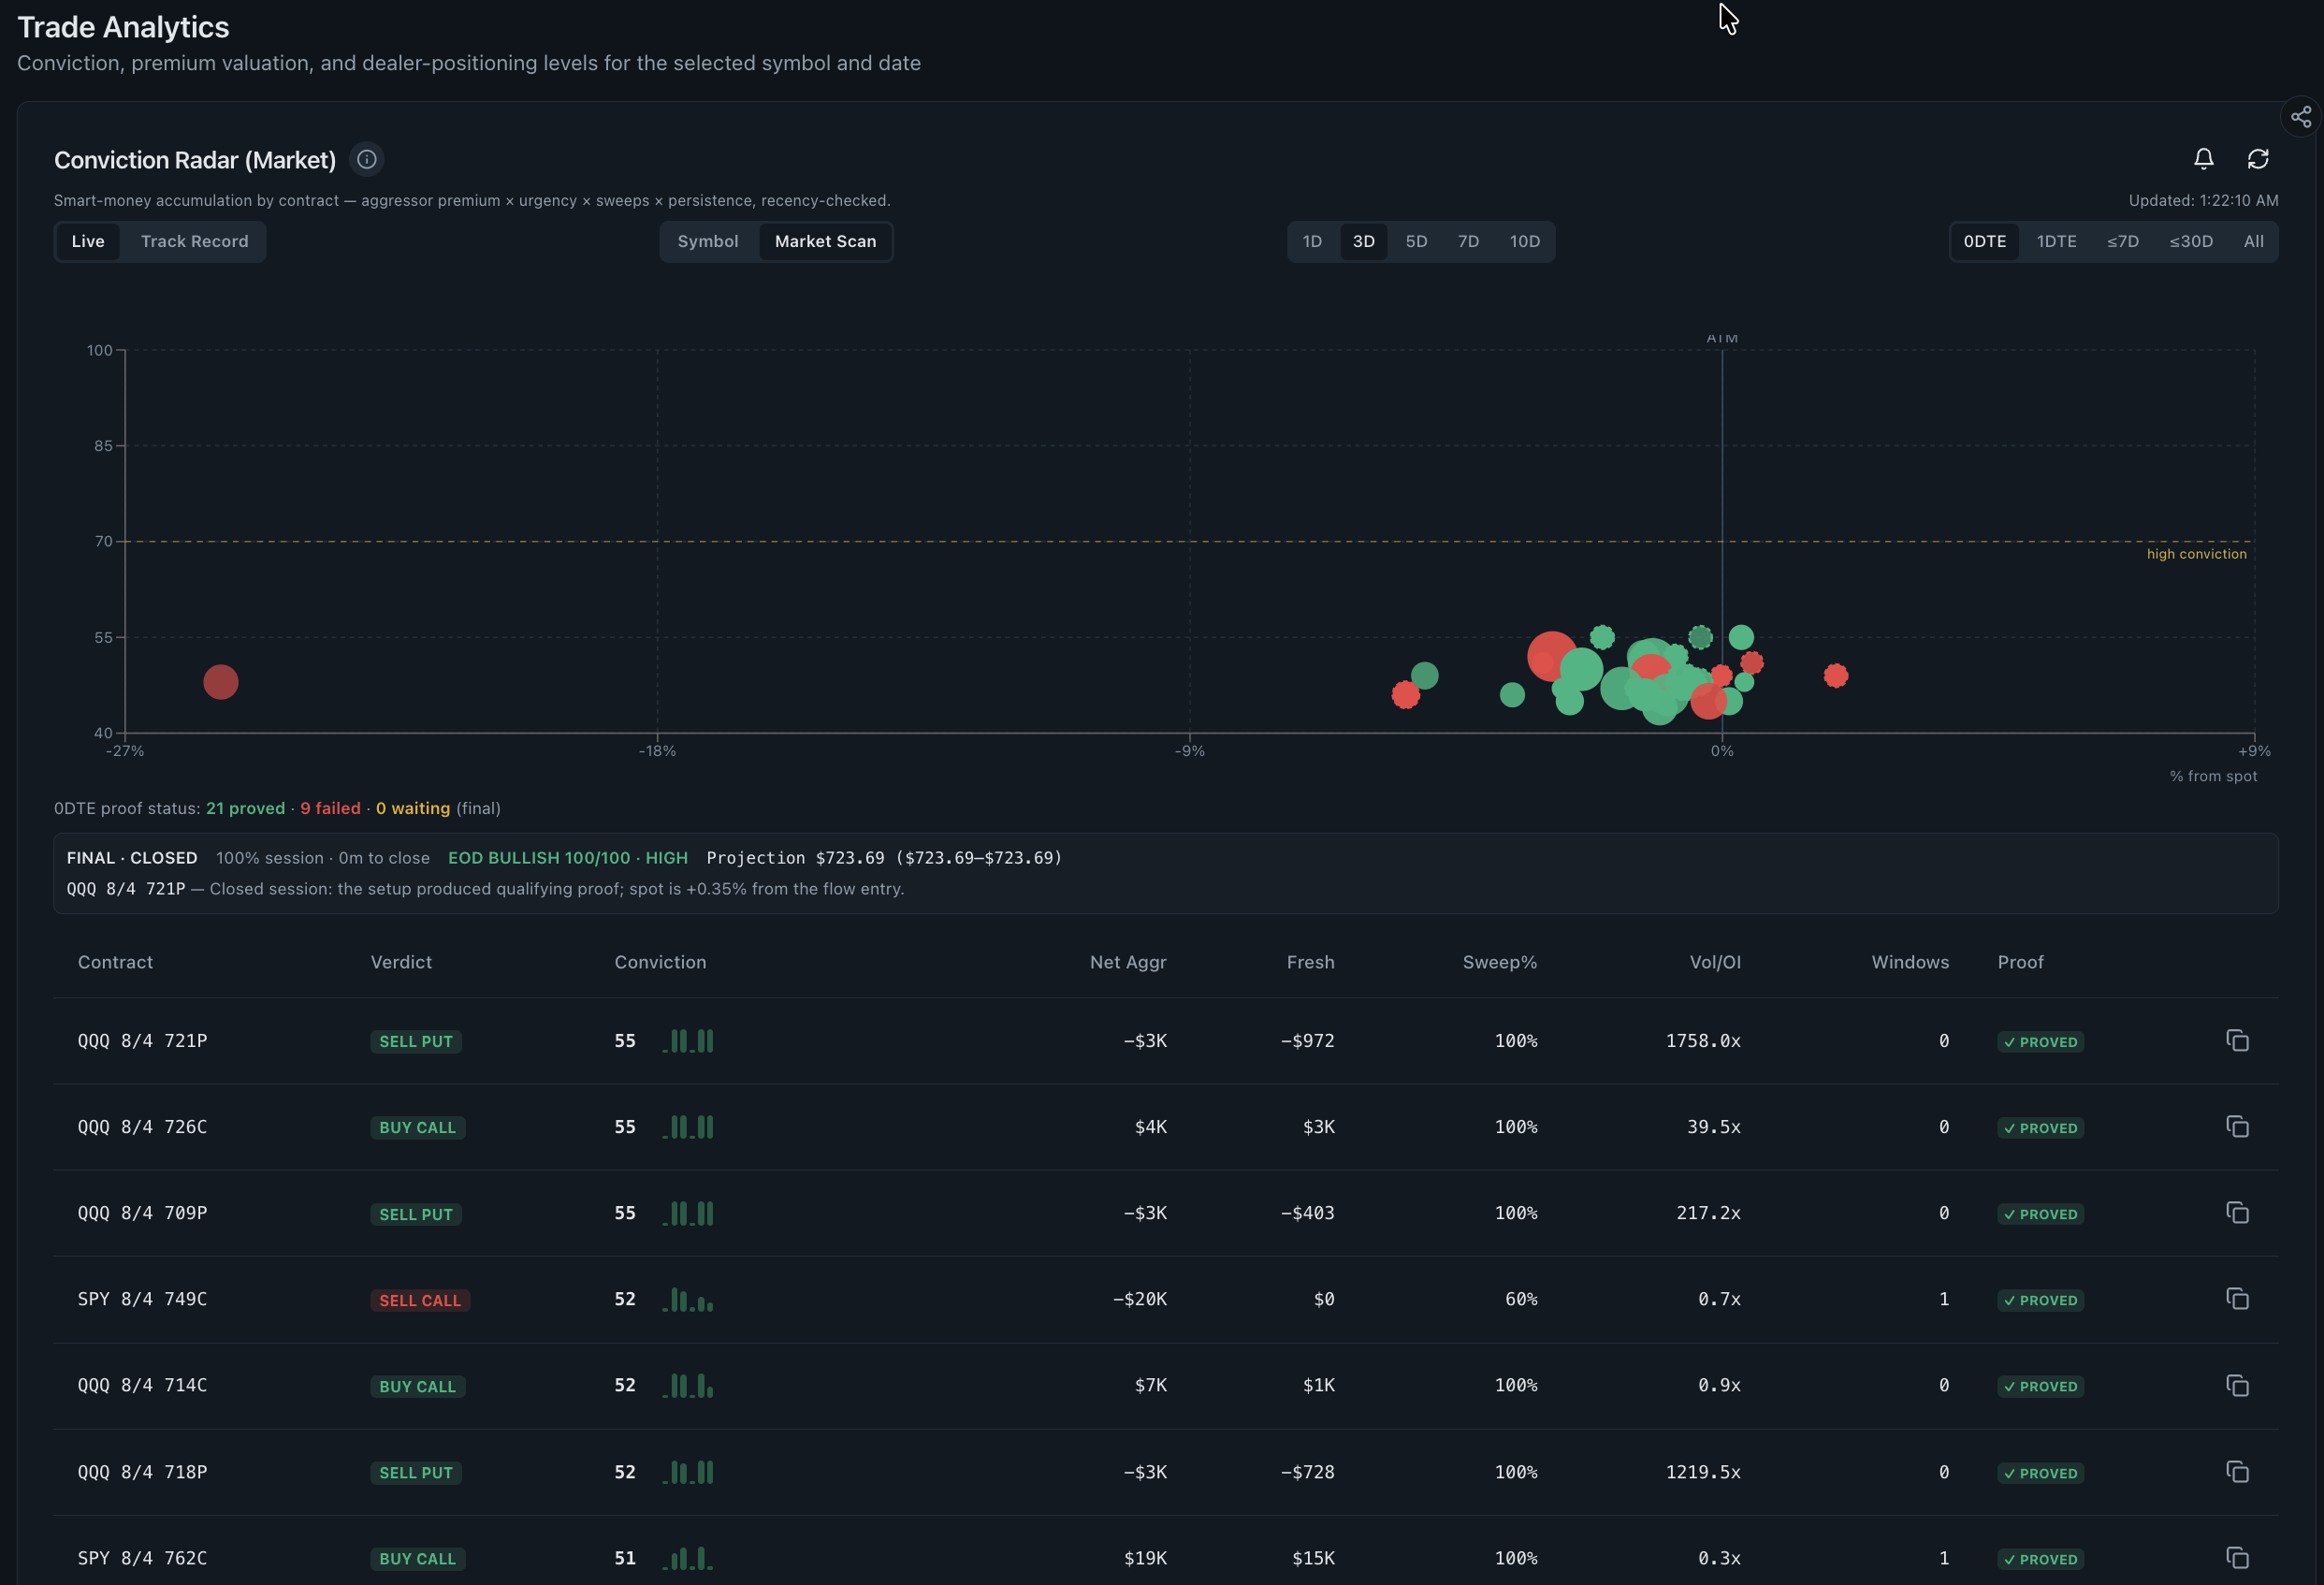
Conviction Radar market scan with contract bubbles conviction scores evidence status and contract table
Historical Conviction Radar example captured on August 5, 2026. Buy, sell and conviction labels shown in the interface are classifications, not trading instructions. Open the image for the full-resolution chart labels.

Contract evidence triage

Conviction Radar

A market scan uses premium, urgency, sweep share, persistence and recency to rank contracts and track whether predefined historical evidence conditions were met.

Use case
Reduce a large contract universe to a manageable review list, then inspect the underlying price, chain, expiry, open interest and event context.
Research benefit
Combines current ranking with visible proved, failed and waiting states so the heuristic can be evaluated instead of accepted on branding alone.
Research boundary
Conviction is a heuristic score, not a probability. On-screen buy or sell wording classifies observed contract activity and must never be read as an instruction.
Read the complete Conviction Radar guide
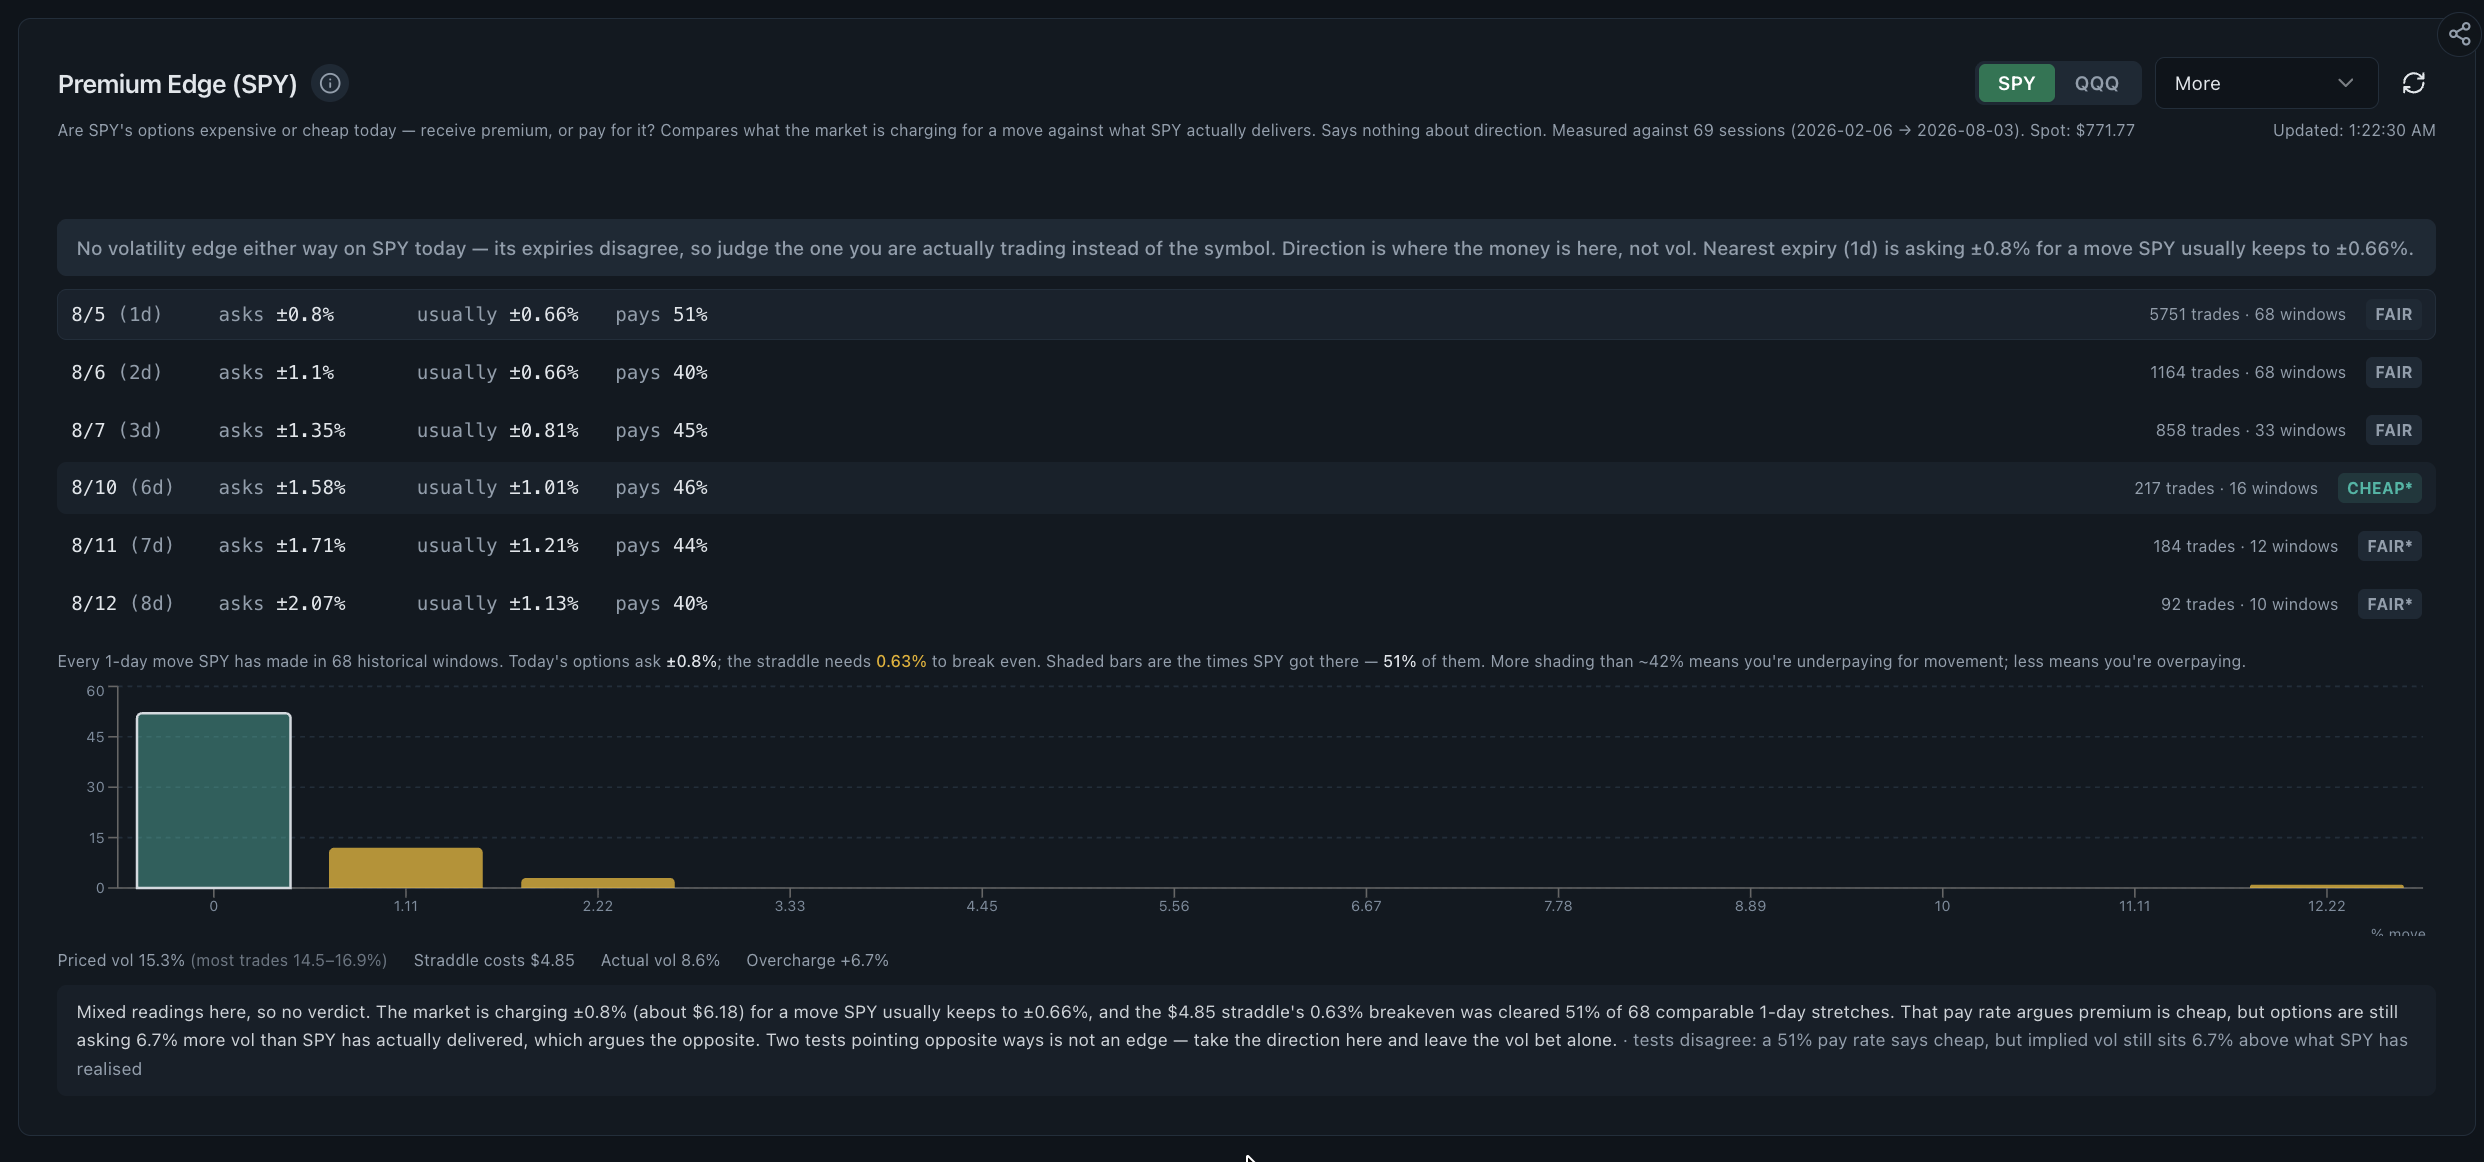
Premium Edge for SPY comparing priced option moves straddle breakeven and historical observed movement by expiry
Actual Premium Edge screen captured on August 5, 2026. The historical sample and expiry labels are illustrative, not a volatility forecast or strategy recommendation. Open the image for the full-resolution chart labels.

Implied-versus-observed movement

Premium Edge

Expiry rows compare the option market's priced move and straddle breakeven with movement observed across comparable historical windows.

Use case
Review the relative price of optionality across expiries before investigating volatility, event timing, liquidity and contract-specific risk.
Research benefit
Makes the assumptions behind cheap, fair or expensive labels visible through window counts, observed moves and pay-rate context.
Research boundary
Historical movement is sample-dependent and not a forecast. Cheap, fair and expensive labels are relative model outputs, not strategies or claims of edge.
Read the complete Premium Edge guide
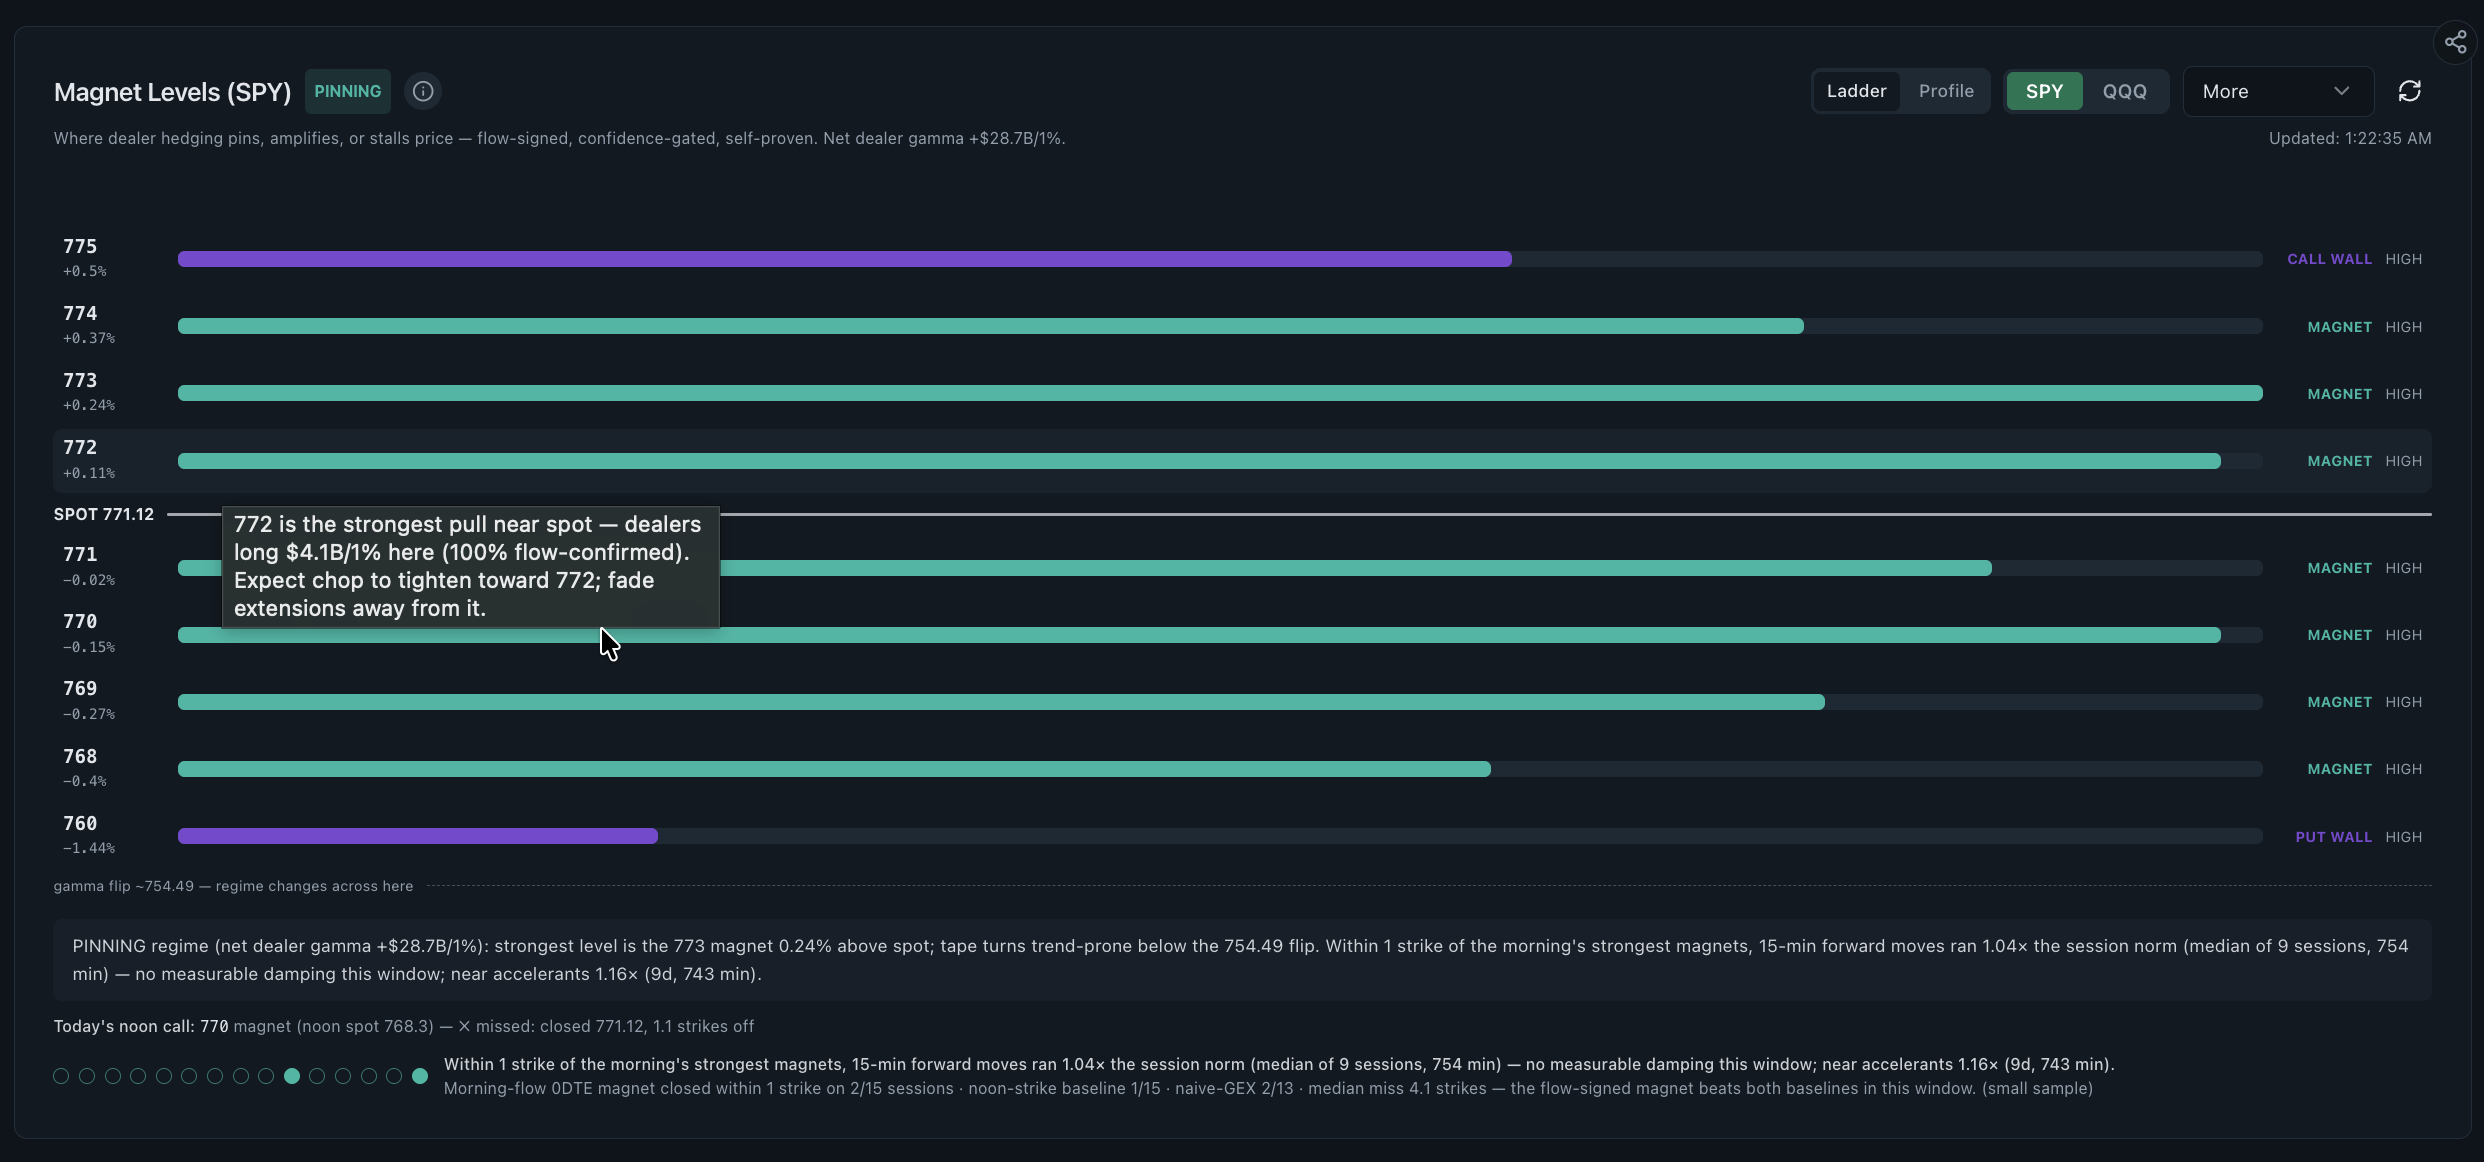
Magnet Levels for SPY with modeled dealer gamma call wall put wall gamma flip and spot
Historical Magnet Levels screen captured on August 5, 2026. Modeled magnets and walls are monitoring references, not guaranteed support, resistance or targets. Open the image for the full-resolution chart labels.

Modeled dealer-gamma levels

Magnet Levels

A strike ladder ranks flow-signed dealer-gamma estimates around spot and exposes call walls, put walls, modeled magnets, confidence and sample evidence.

Use case
Mark strikes where the model expects relatively different hedging sensitivity, then watch actual price and flow rather than assuming a level will hold.
Research benefit
Concentrates dealer-positioning assumptions, confidence gates and observed sample notes in one level map that can be challenged by live evidence.
Research boundary
Dealer positioning is estimated from public data. Magnet, wall, pinning, support and resistance language describes a model—not a promised price path.
Read the complete Magnet Levels guide
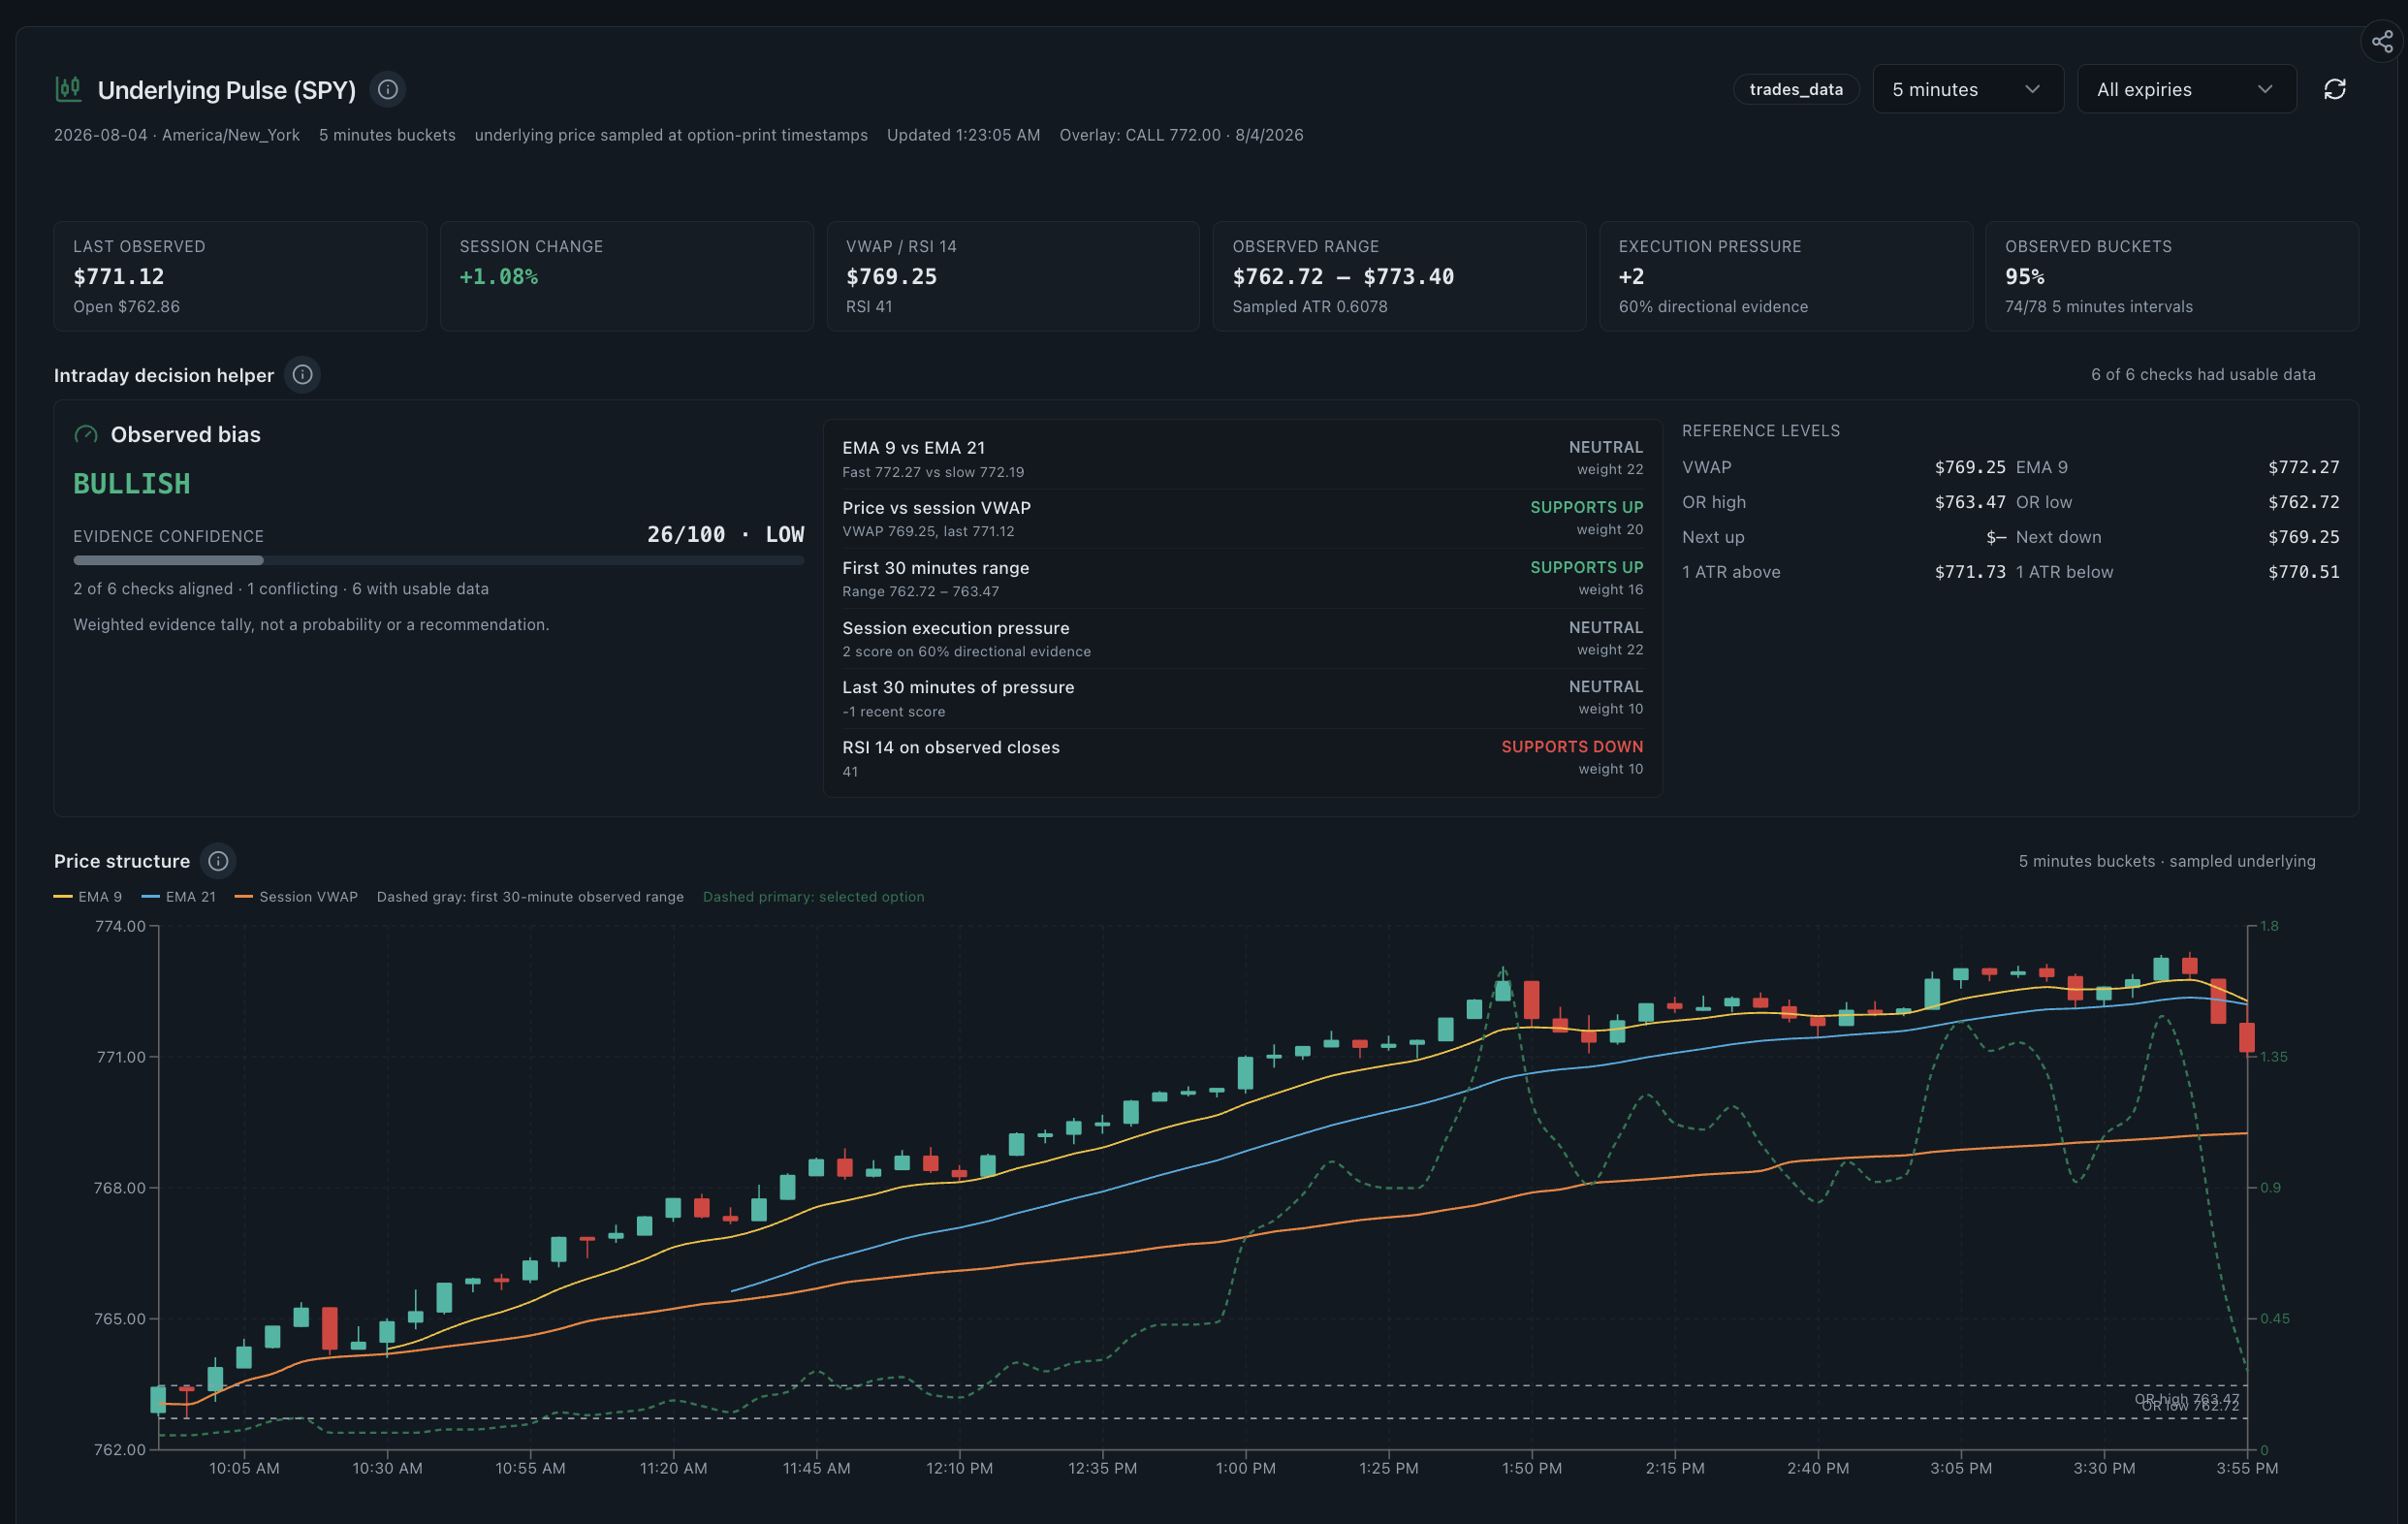
Underlying Pulse for SPY with observed bias evidence checks VWAP reference levels and intraday price structure
Underlying Pulse overview captured on August 5, 2026. The historical observed-bias score is diagnostic and not a trading instruction. Open the image for the full-resolution chart labels.
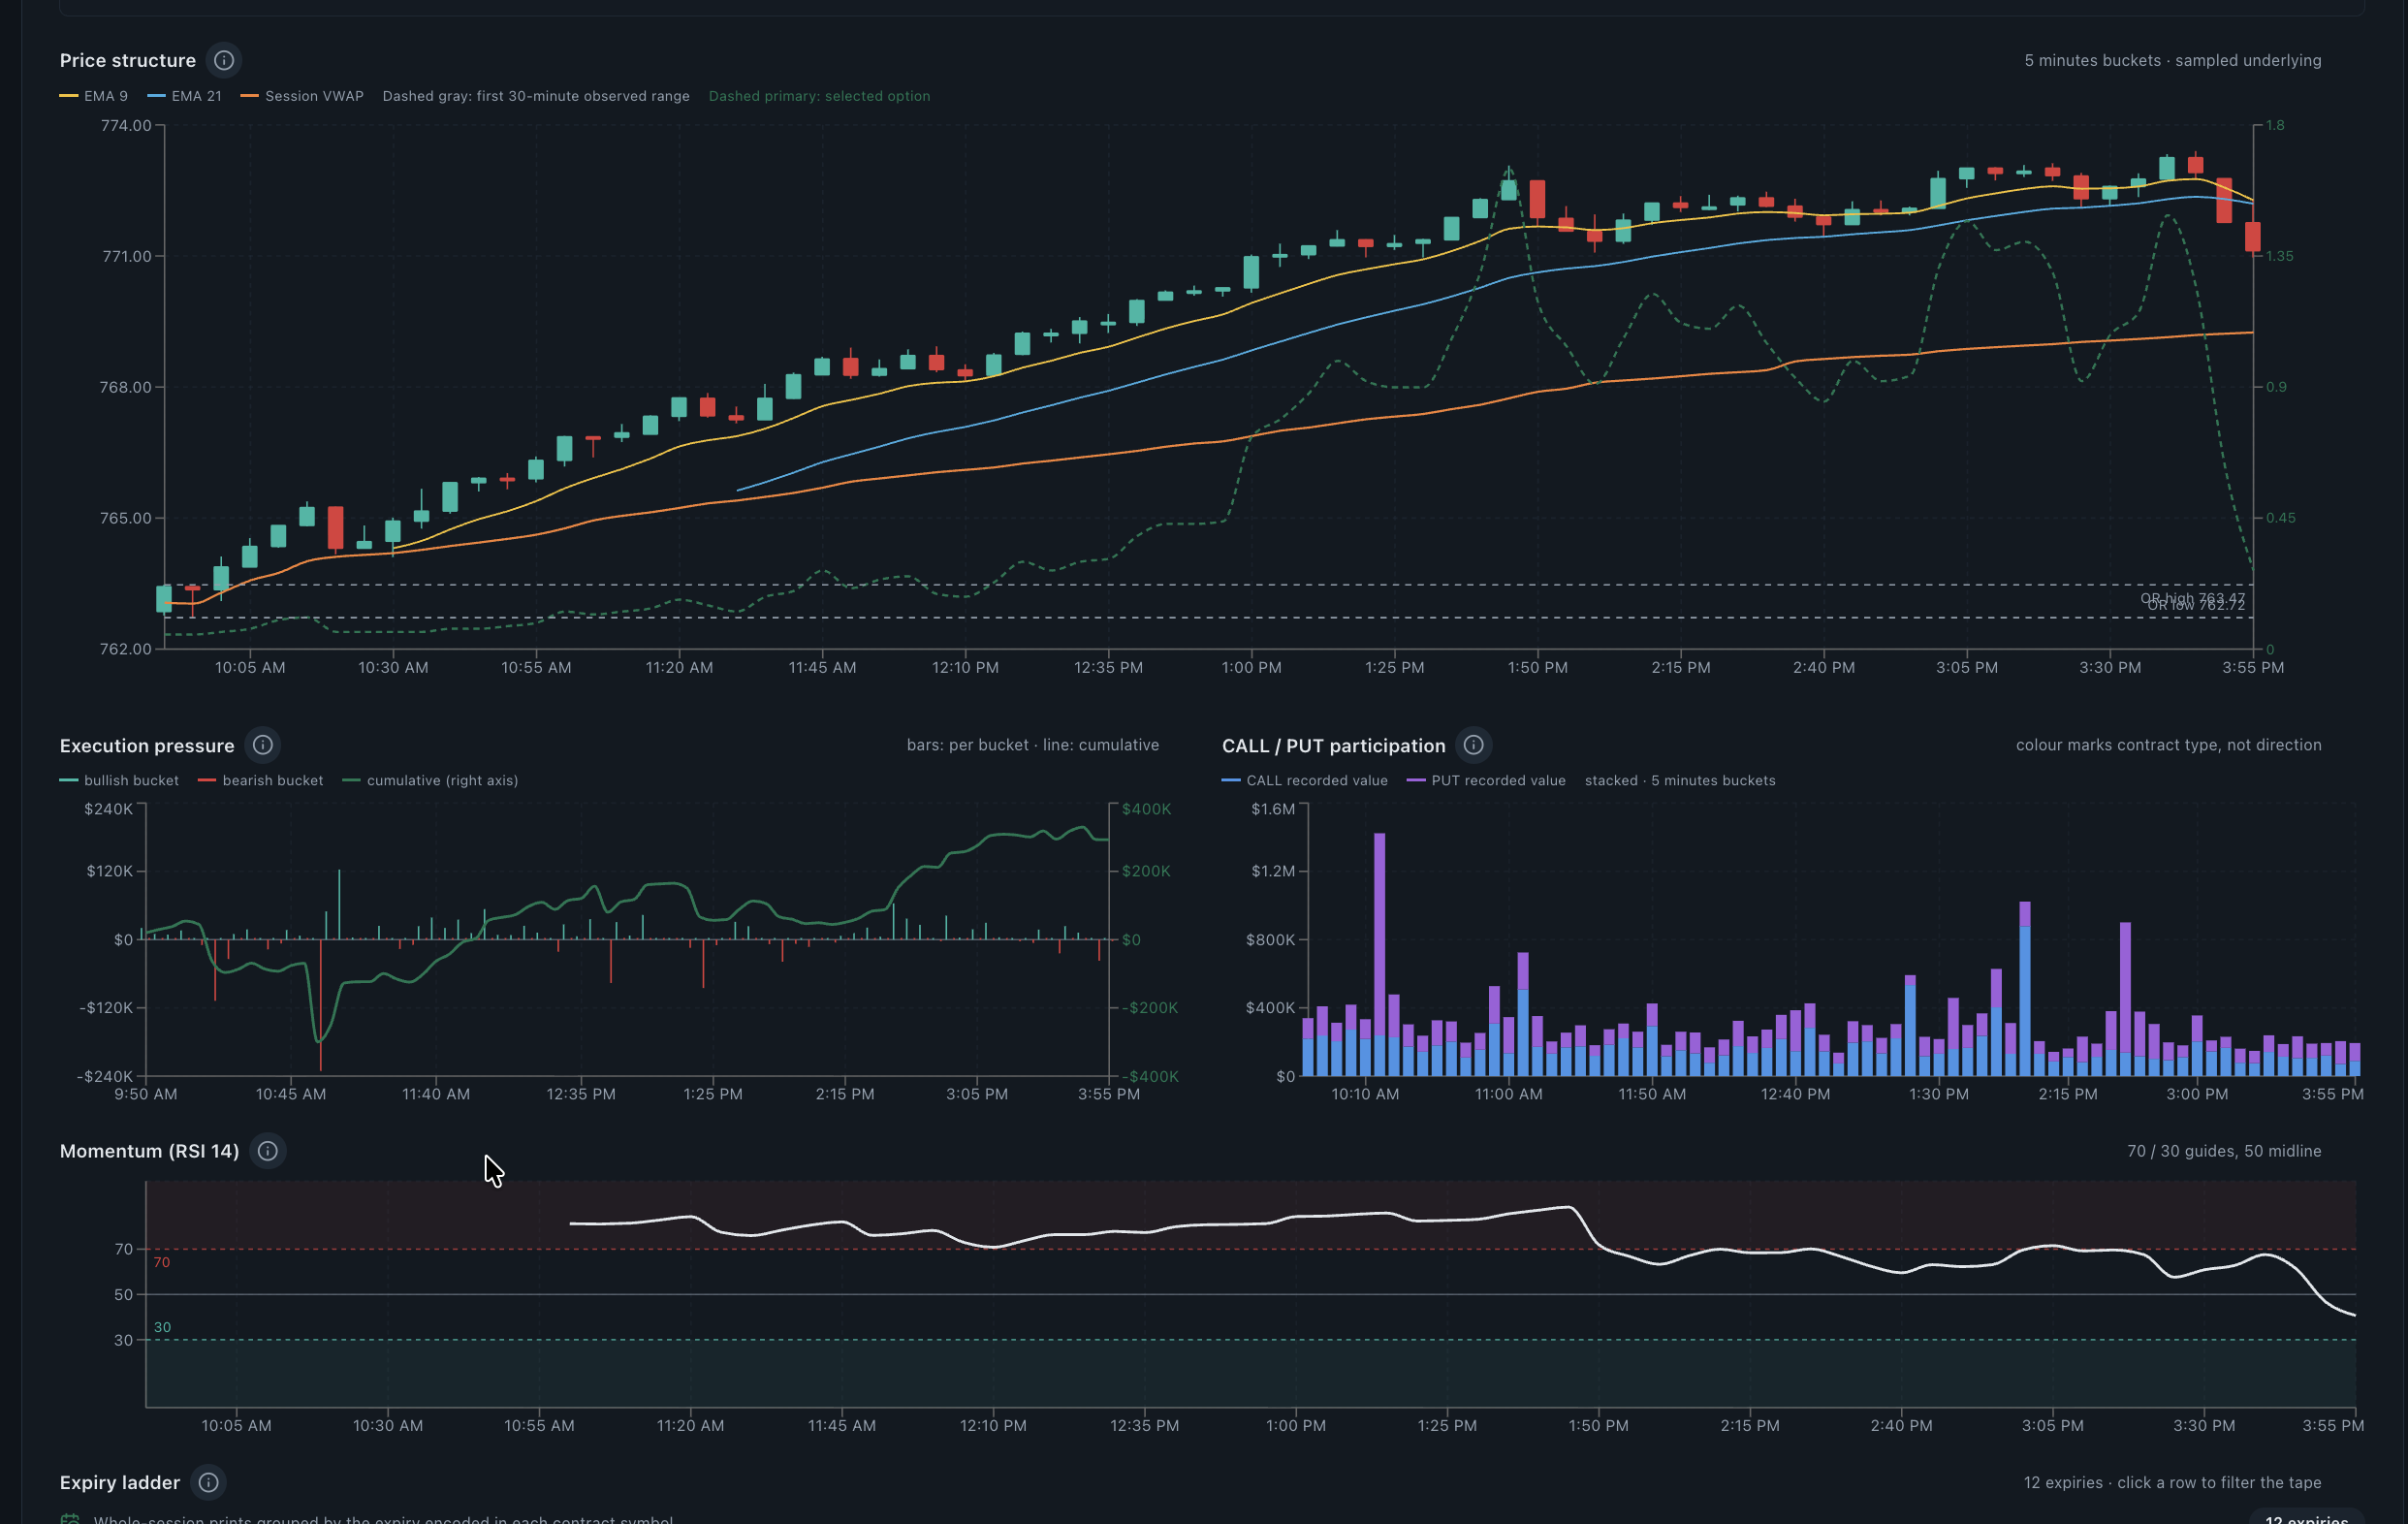
Underlying Pulse detail with price structure execution pressure call put participation momentum and expiry ladder
The same historical Underlying Pulse session continued into execution pressure, call and put participation, RSI and expiry detail. Open the image for the full-resolution chart labels.

Intraday price-and-flow context

Underlying Pulse

An intraday workspace aligns underlying price structure with execution pressure, call and put participation, momentum and expiry concentration.

Use case
Test a ticker-level options-flow narrative against the underlying's price path, VWAP, opening range, momentum and current execution evidence.
Research benefit
Reduces tab switching and makes contradictions visible by keeping price, participation and pressure on consistent session timestamps.
Research boundary
Observed bias and confidence are weighted diagnostics. Indicators can lag, execution side is estimated, and the view does not publish entries, exits or price forecasts.
Read the complete Underlying Pulse guide
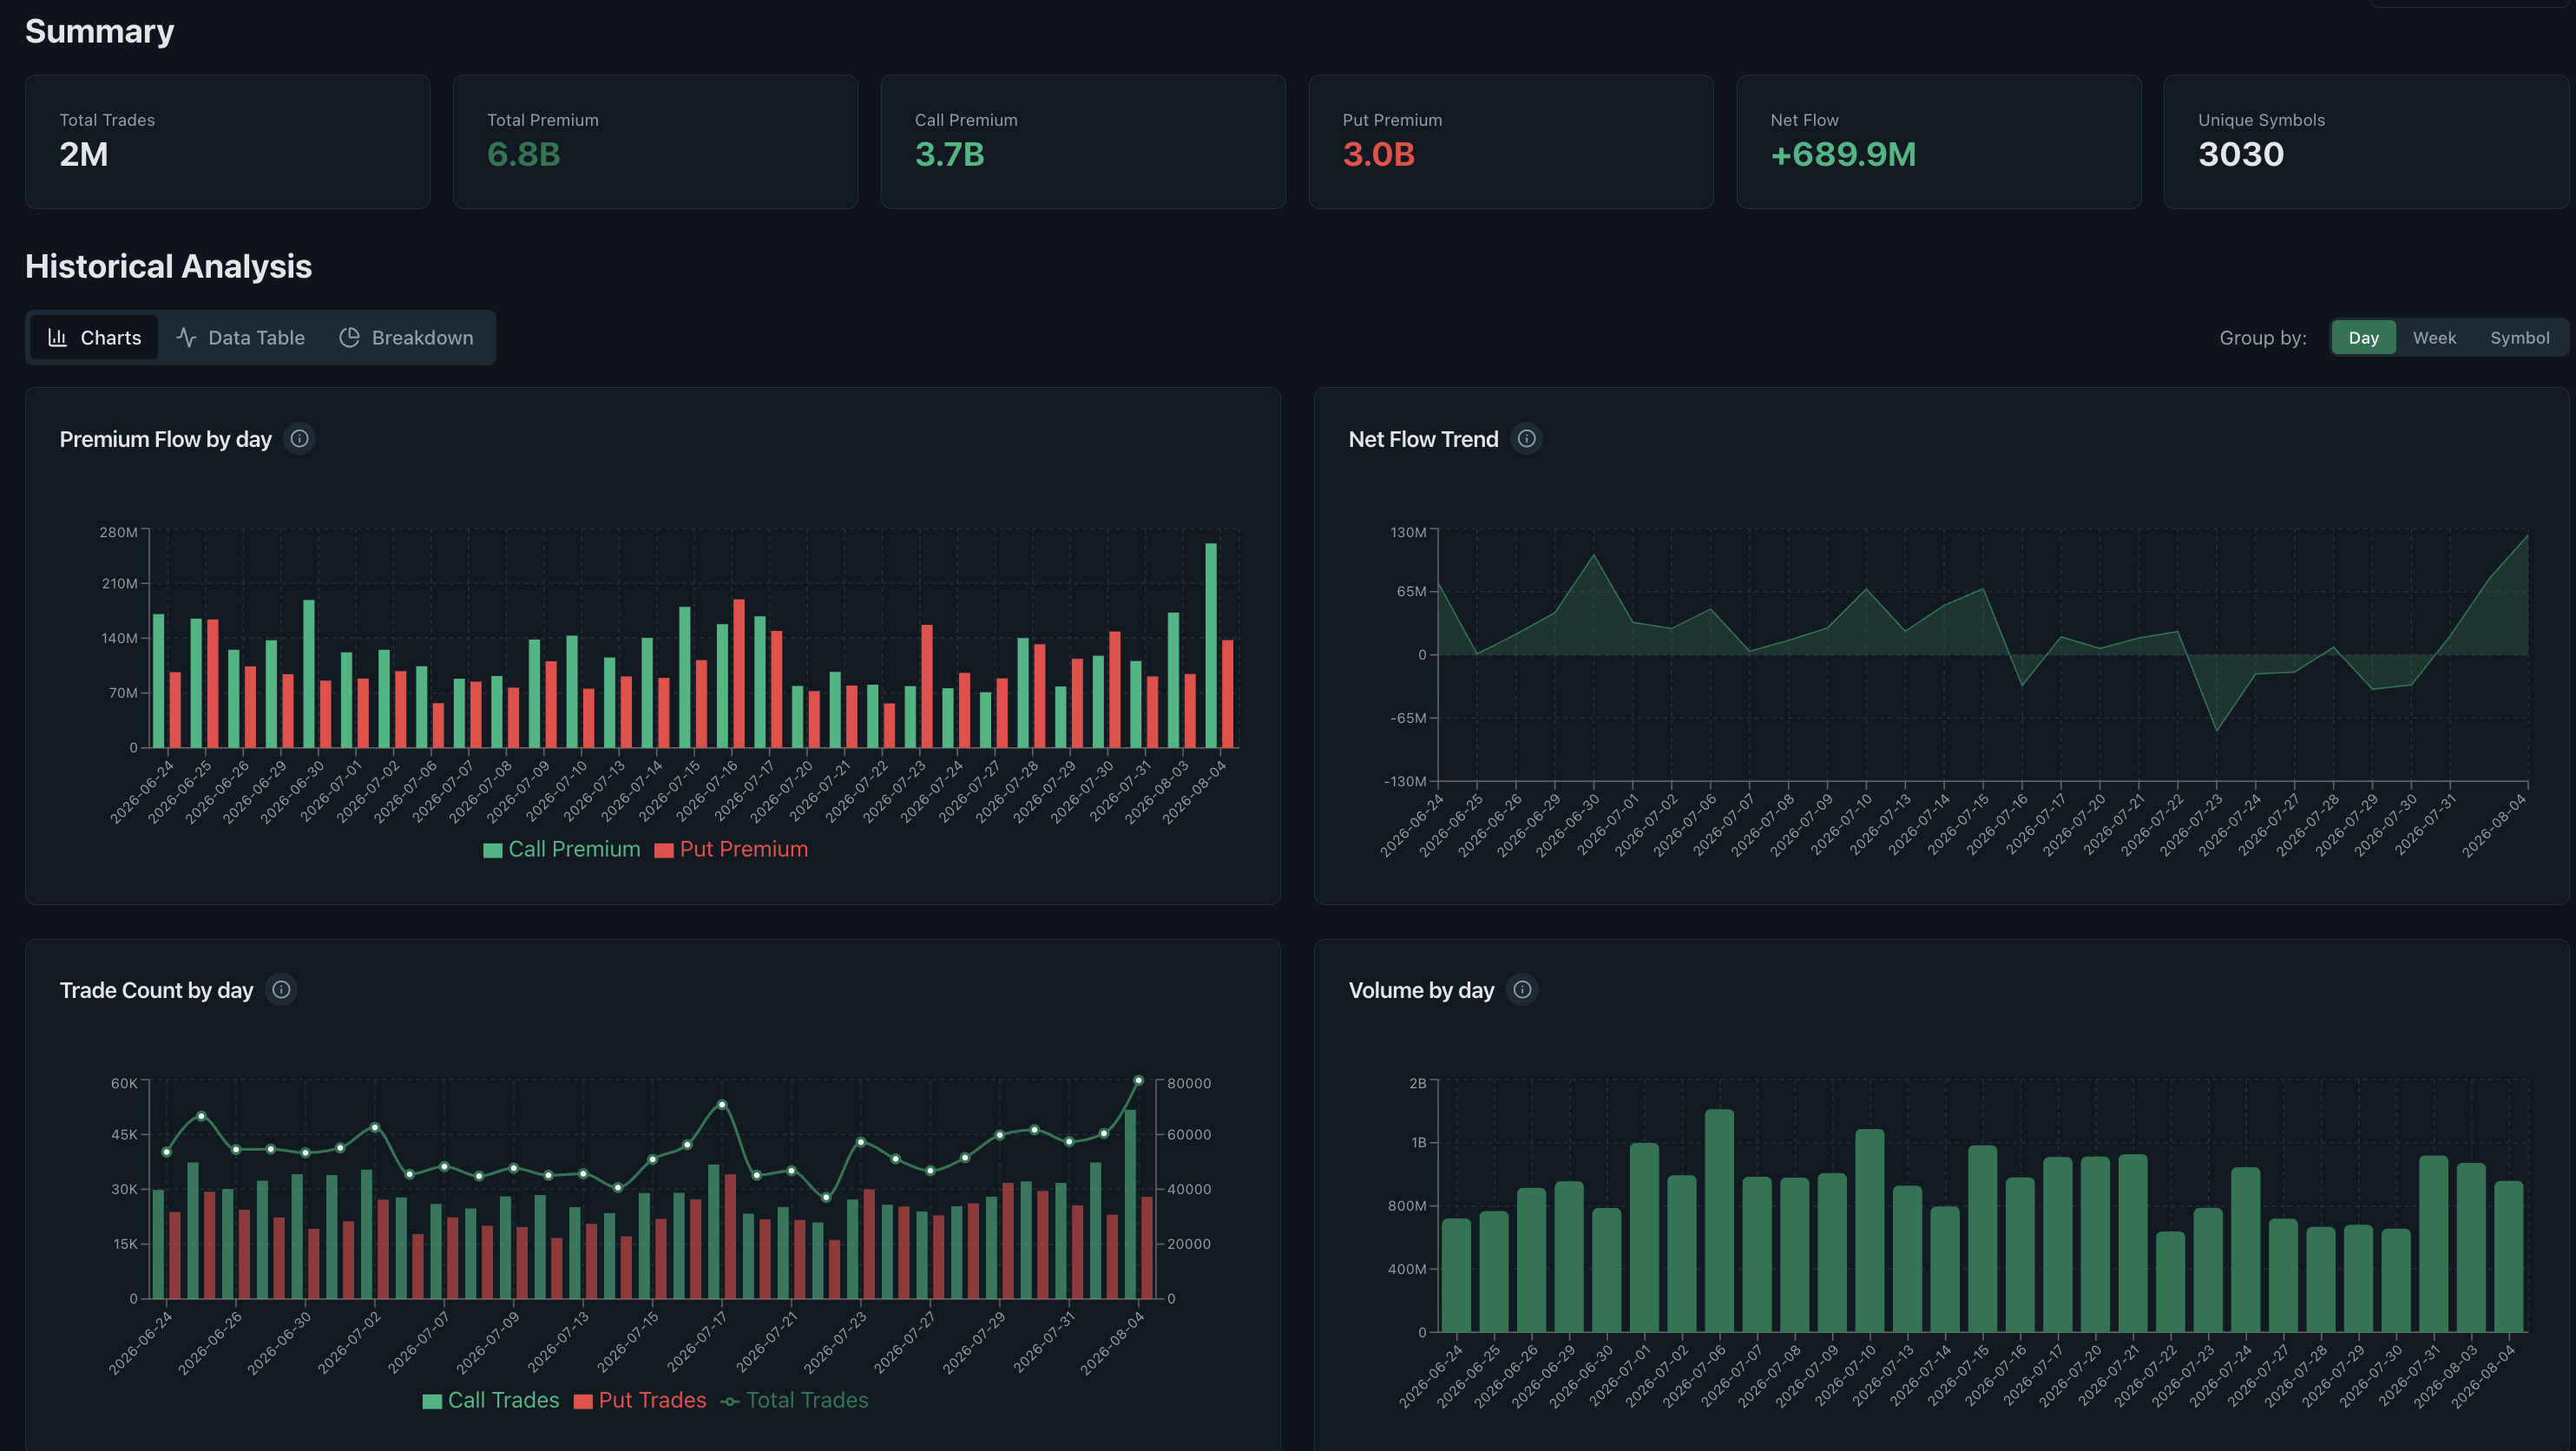
Historical options flow analysis with premium net flow trade count and volume charts by day
Actual Historical Flow Analysis screen captured on August 5, 2026. The completed-session values are examples and do not imply future performance. Open the image for the full-resolution chart labels.

Cross-session context

Historical Flow Analysis

A historical dashboard compares call and put premium, net flow, trade count, volume and symbol breadth across days, weeks or symbols.

Use case
Place a current-session spike beside comparable periods before calling it unusual, persistent or broad-based.
Research benefit
Shows several activity measures together so one large premium day is not confused with broad participation or repeat behaviour.
Research boundary
Historical charts describe completed activity. Similar-looking periods can have different catalysts, volatility regimes and outcomes, so past patterns are not forecasts.
Read the complete Historical Flow Analysis guide