Read options flow in real time, with the context around it

Trace market-wide activity to the ticker, strike and expiry, then check open interest, Greeks and price before drawing your own conclusion.

Limited-time offer: WELCOME15 · 15% off

  • 3-day trial
  • $29/month Pro
  • $24.5/month with WELCOME15
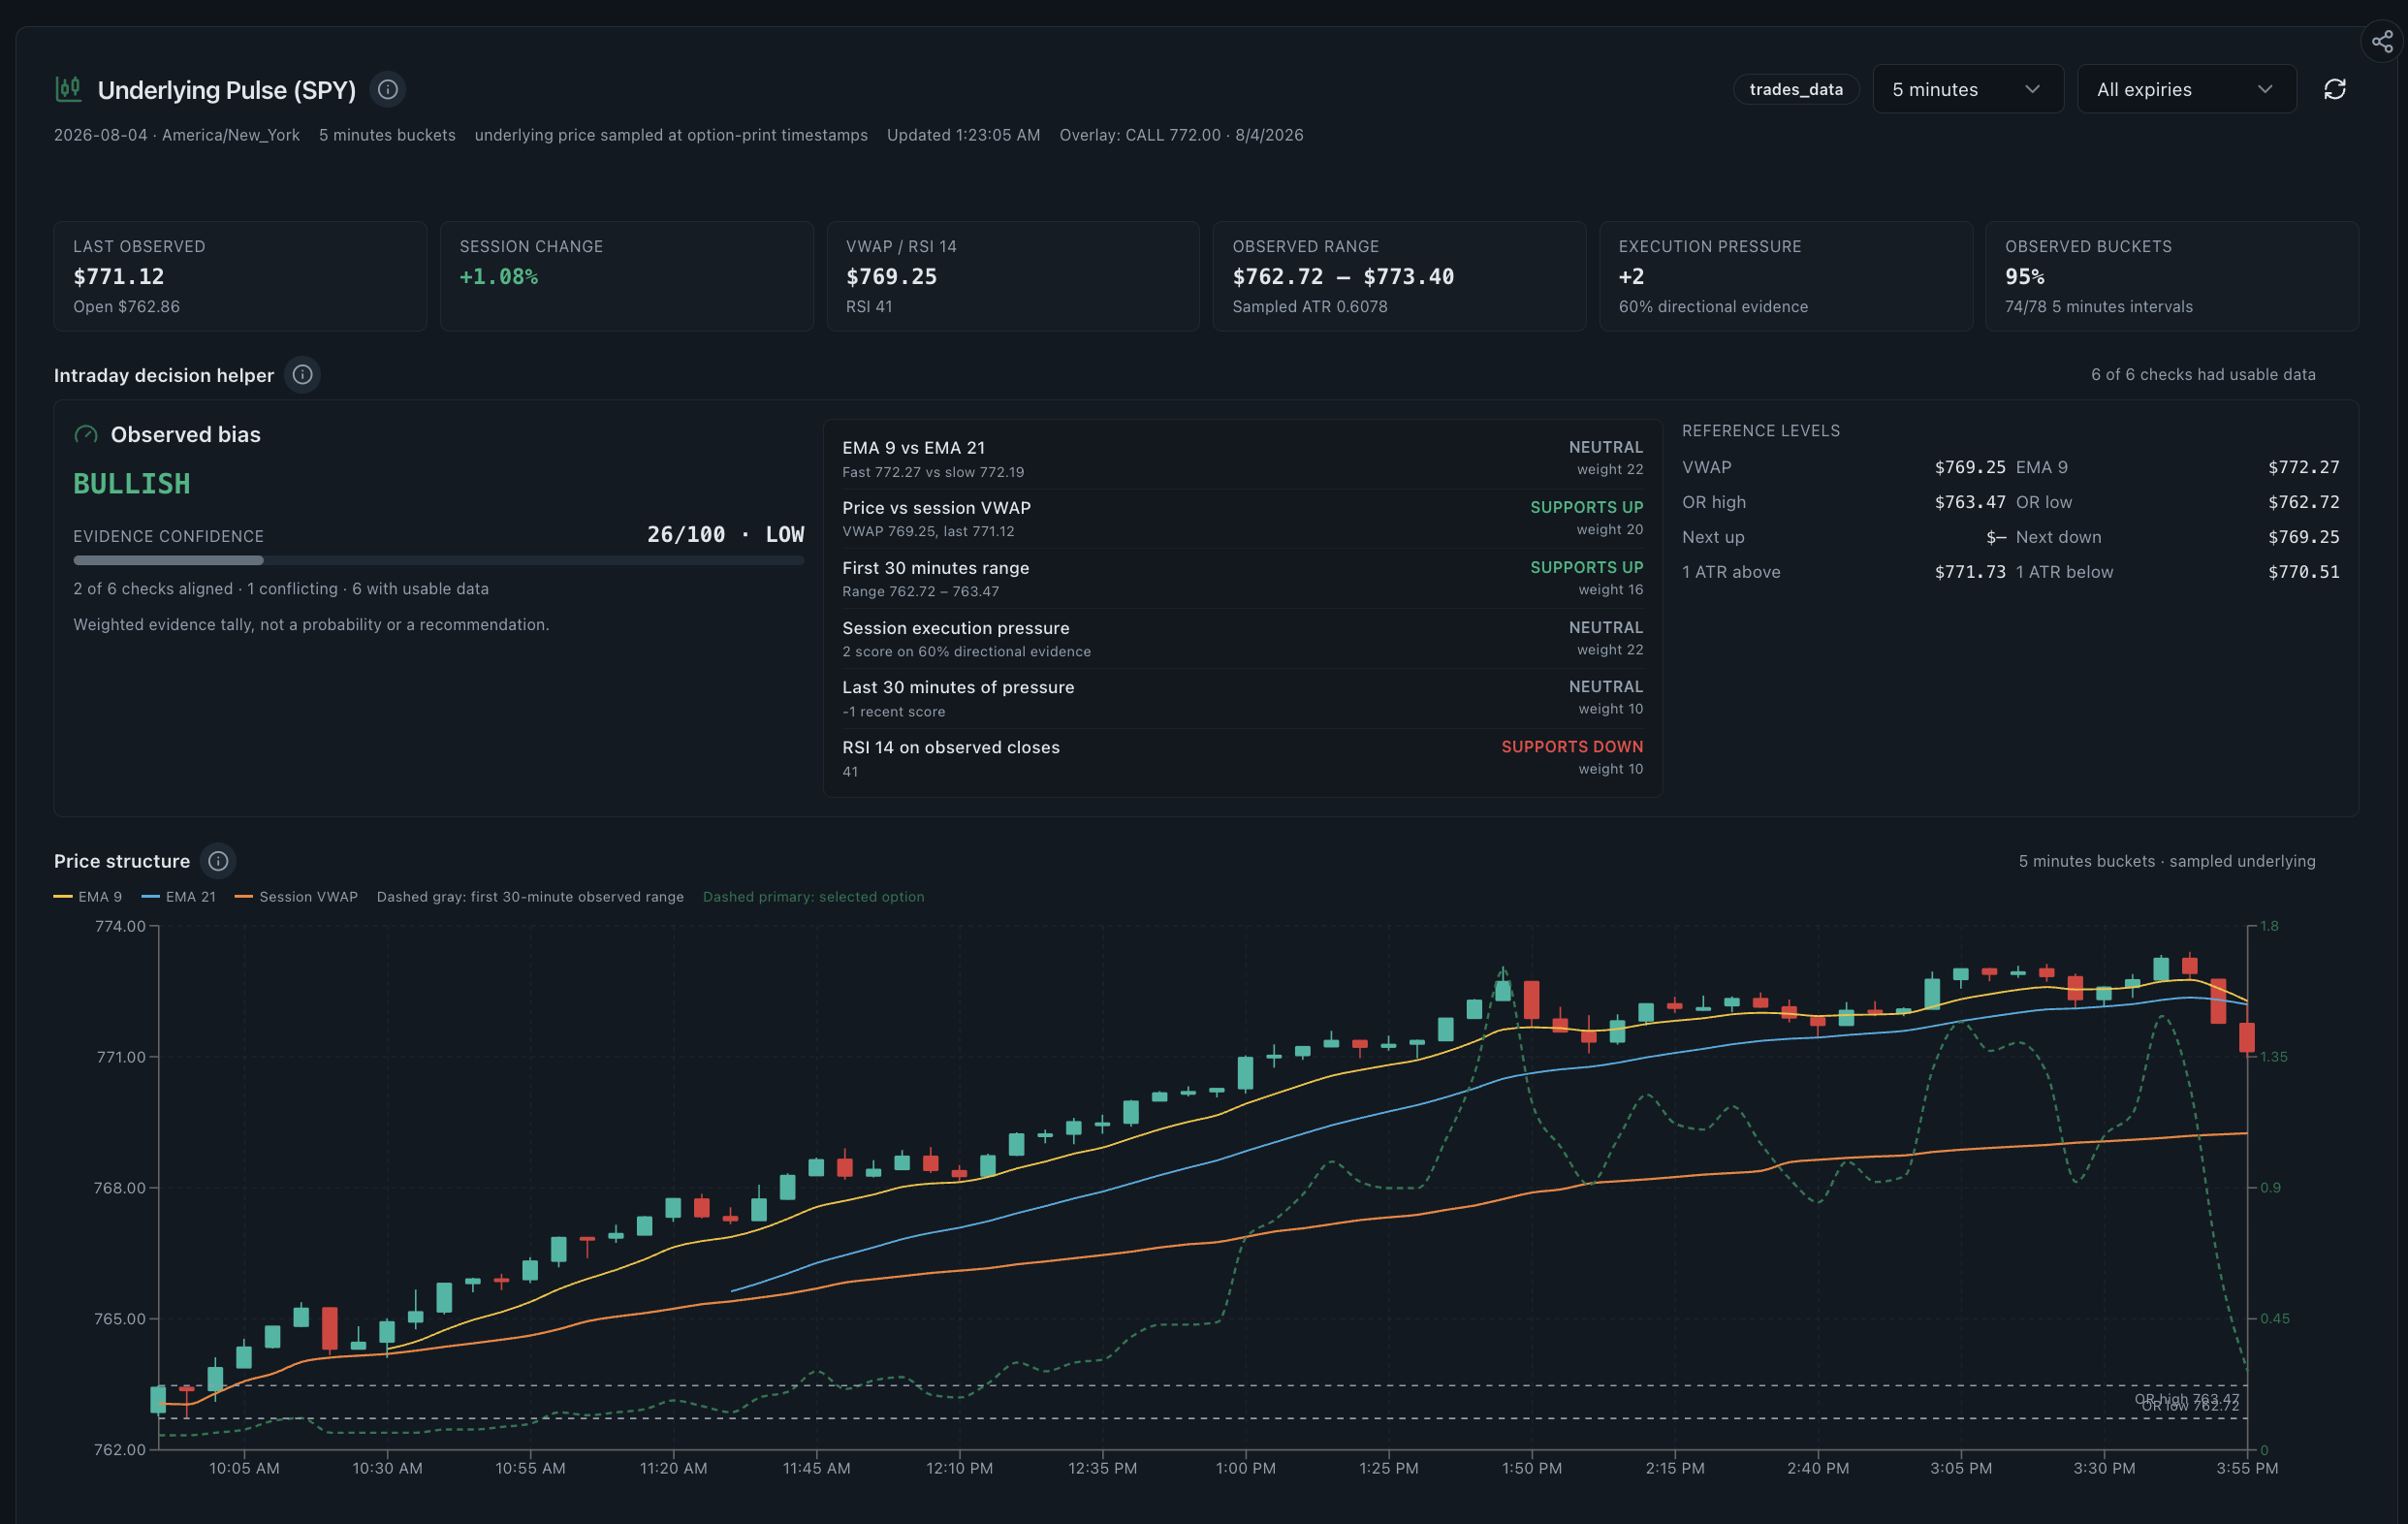
Realtime Options weighted net flow dashboard showing call and put pressure research beside SPY price
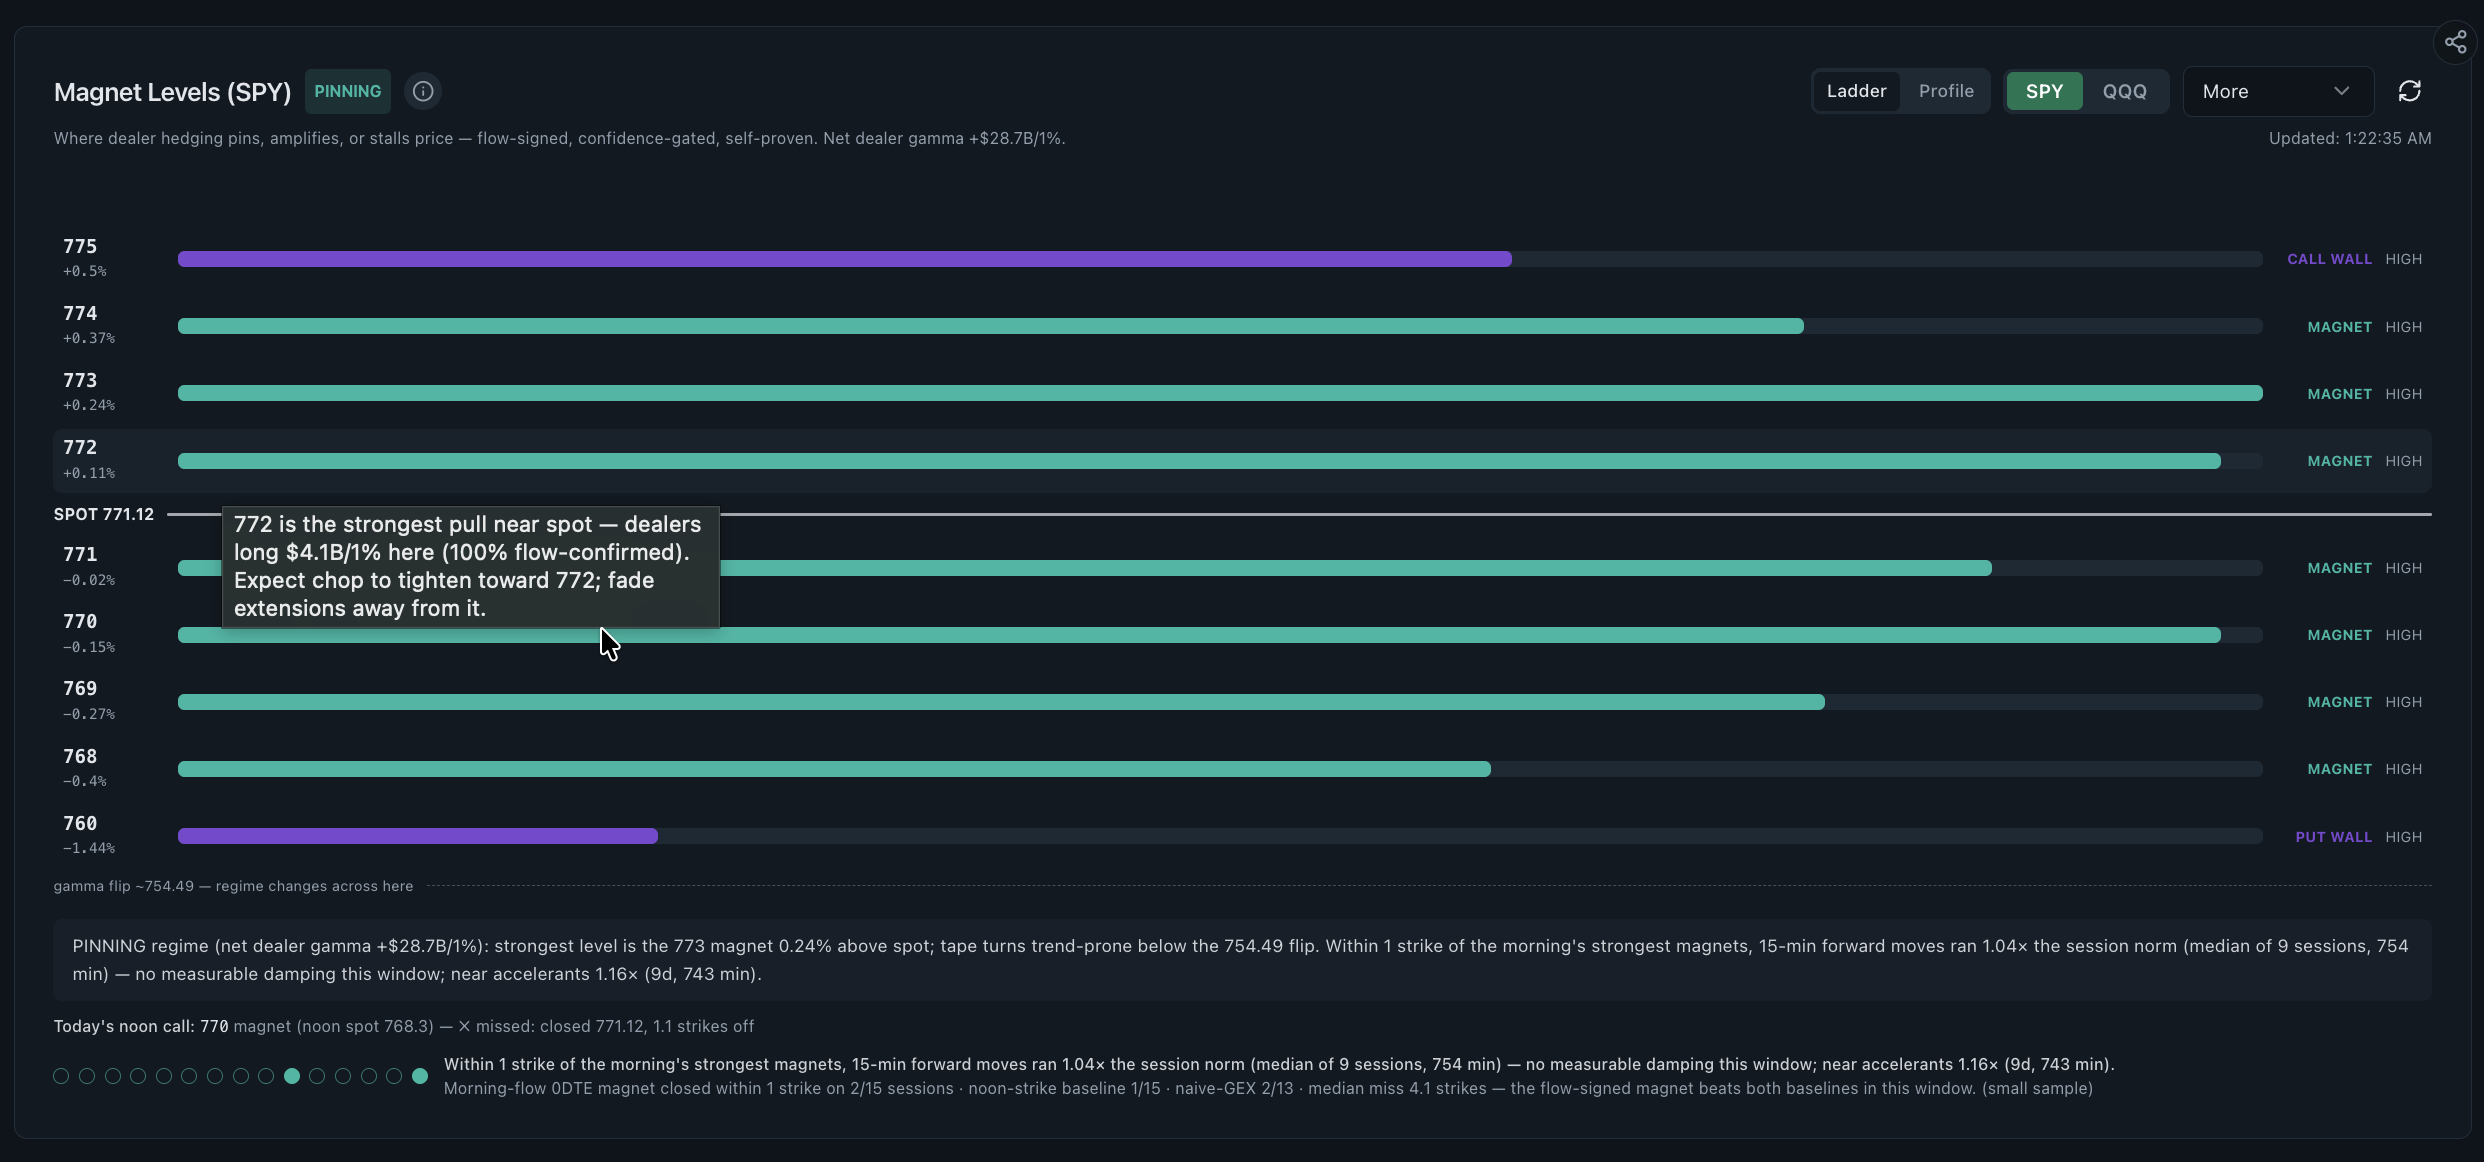
Buy sell pressure analysis chart comparing call premium against put premium in five-minute buckets across an SPY sessionOpen interest heatmap for SPY showing twenty strikes against twelve expiries with the call wall at 780, the put wall at 765 and a put and call open interest profile
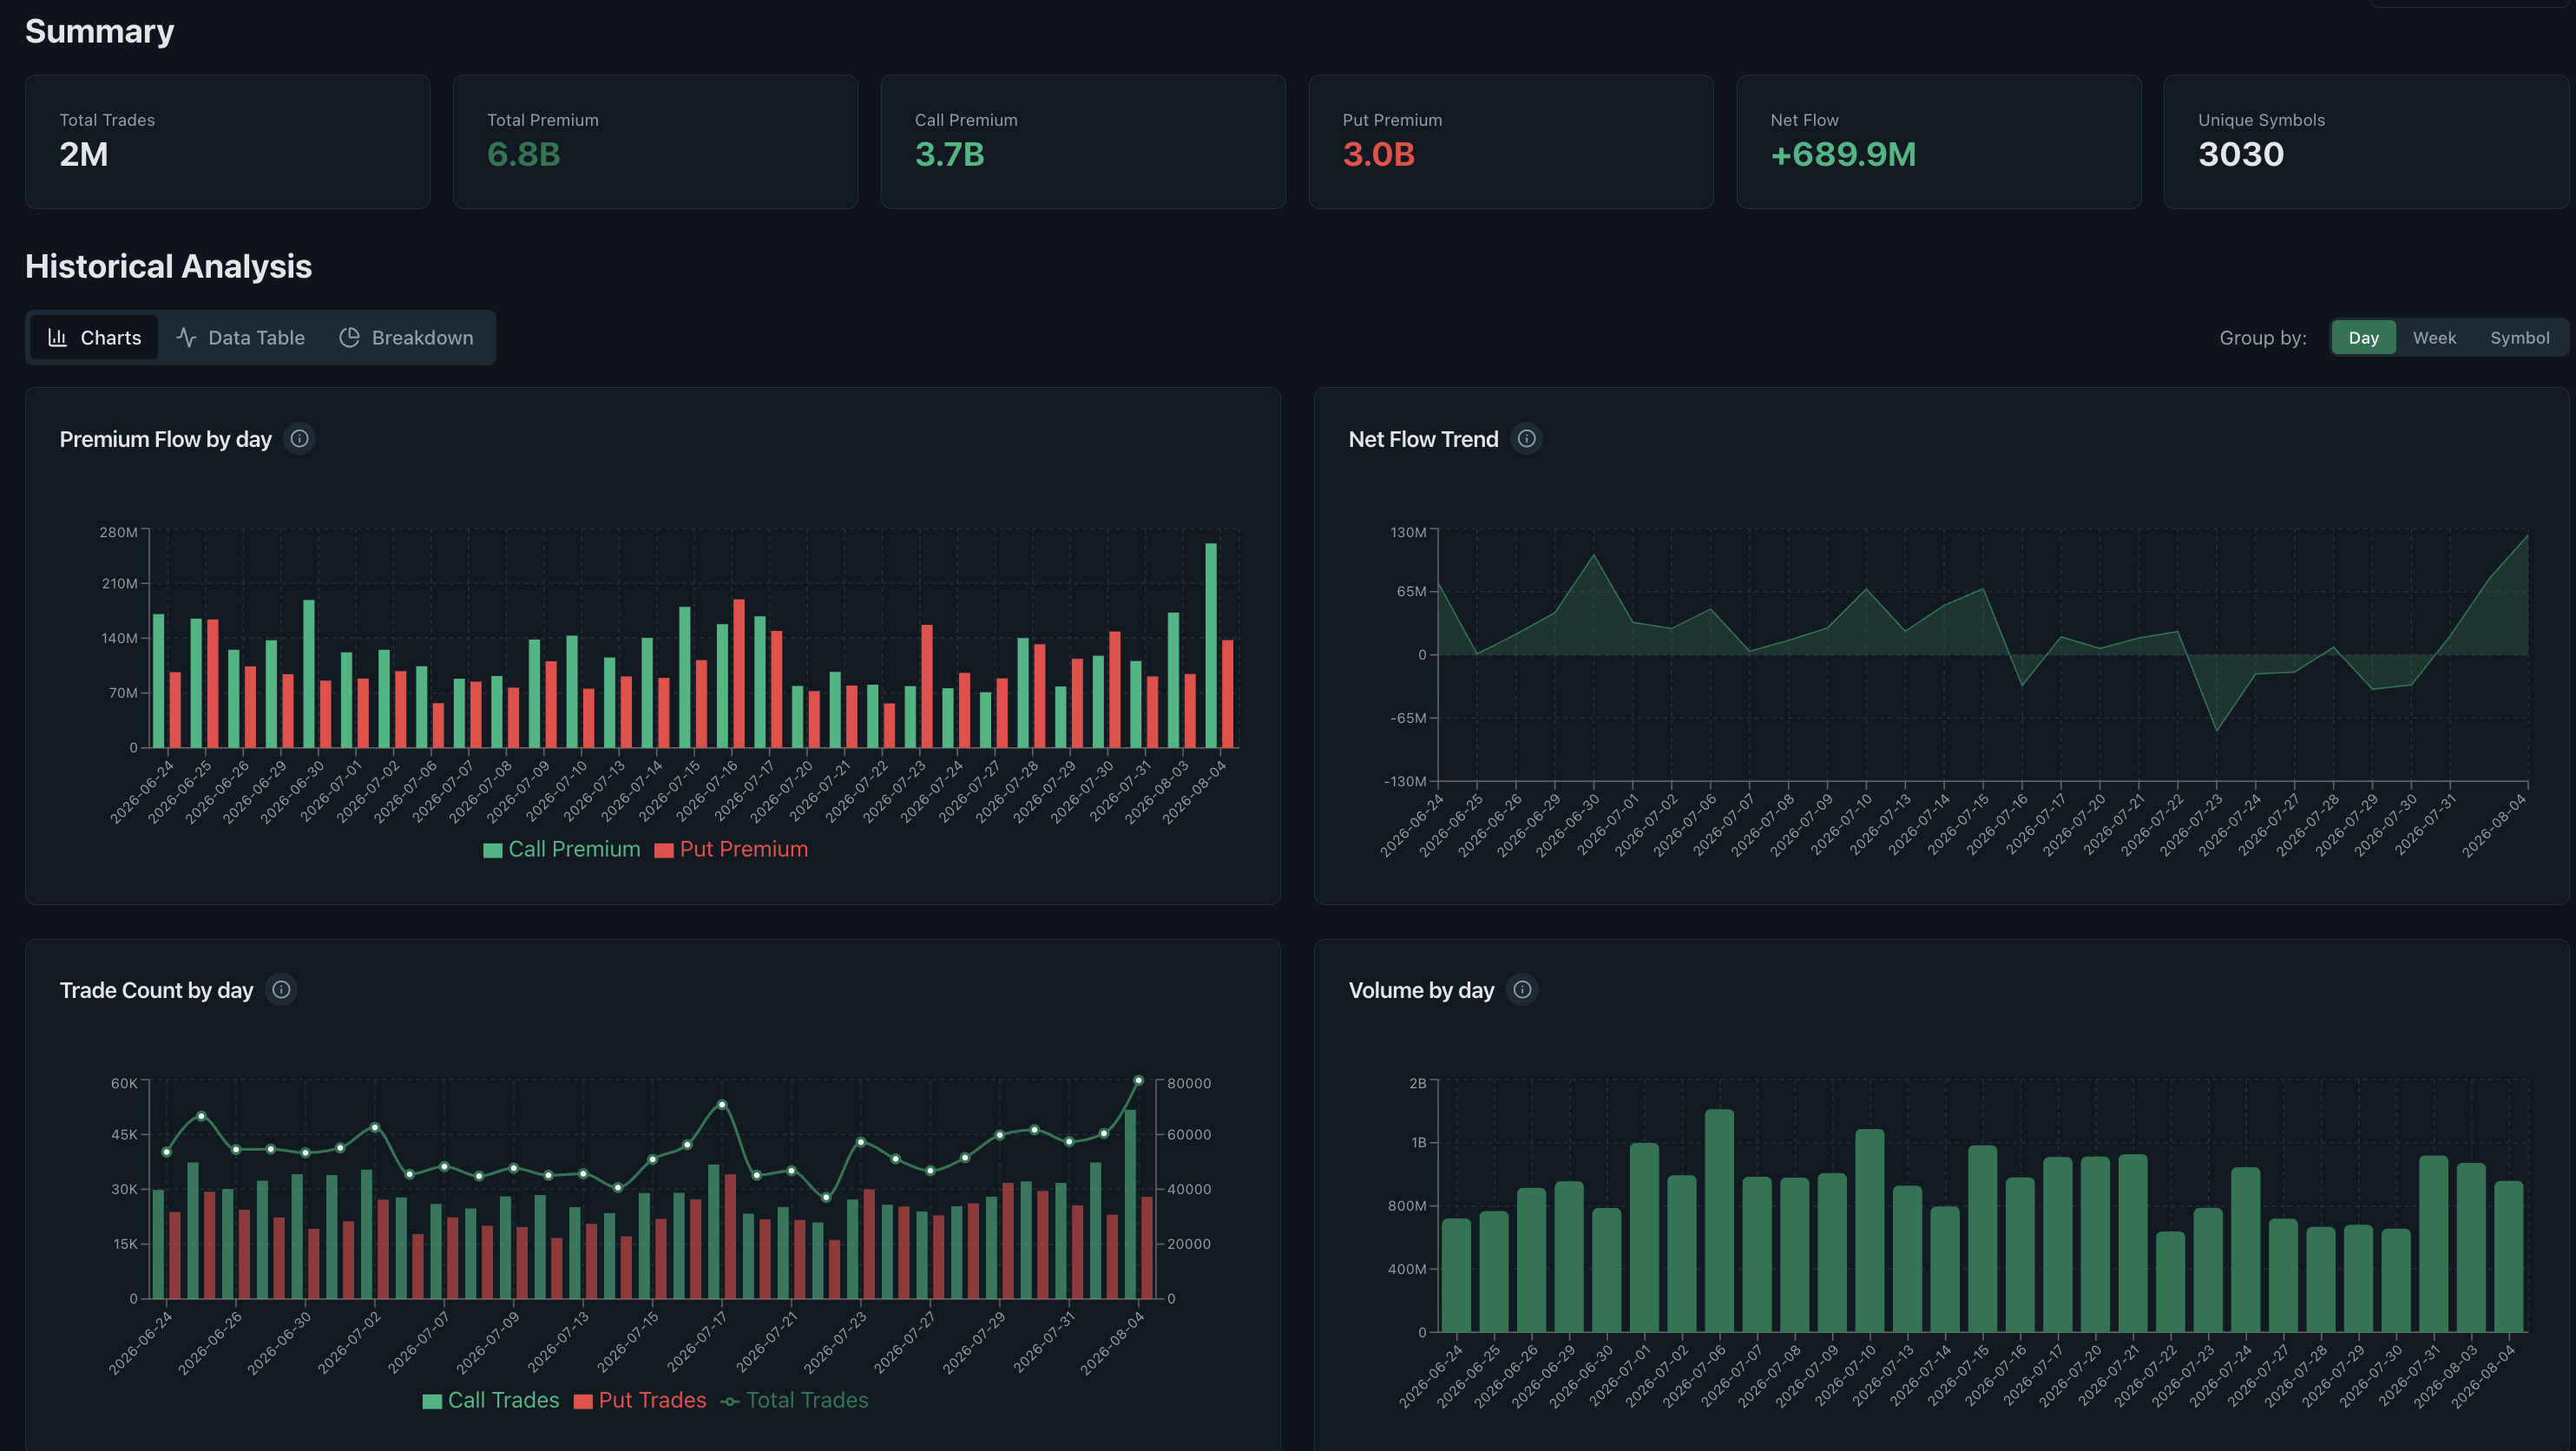
Actual product screens. Historical captures show the interface, not current market data or expected outcomes.

Options flow tools in one visual workspace

Move from market-wide activity to ticker, strike, expiry, price and catalyst context, then save observed-data conditions for in-app and optional email alerts.

SPY Algo Flow chart with OTM moneyness mid-market execution and three-minute interval filters above call premium put premium and price
Actual SPY Algo Flow chart captured on August 25, 2026 with OTM, mid-market and three-minute controls selected. Values are a historical interface example, not current market data or a recommendation. Open it to inspect the full interface.

See the workspace before you sign up

Move through real dashboards, scanners, filters, alerts and watchlists. Open any capture, then read the method only when you need it.

Explore every product view

Use the controls, swipe, or scroll sideways to continue.

1 / 13

Historical screenshots explain the interface. They are not current data, signals or expected outcomes.

Explore all tools

Options trading data coverage

One research dashboard for the US options market: options flow, quote context, option chains, open interest and sentiment, updated continuously through the trading day.

Options flow and market data

Near real-time options flow with sweep and block detection, unusual options activity, net premium, volume and put/call ratio trends, so you can research how aggressive money is positioning across the market.

Calls, puts and option chains

Calls and puts across every strike and expiry: option chain heatmaps, open interest by strike, Greeks including gamma, vanna and charm, plus contract-level bid, mid and ask premium context.

US stocks, ETFs and 0DTE

Thousands of US-listed stocks and ETFs including SPY and QQQ options, large caps and active single names, plus 0DTE gamma exposure analytics and futures context for ES and NQ.

Data is aggregated from licensed third-party sources and processed into analytics. It is not a direct exchange feed. Pro includes limited authenticated, read-only API access for aggregated Buy/Sell Pressure, Algo Flow, 0DTE Flow & Gamma Exposure, and Greeks by Strike analytics, not raw option-chain data. Read how the data is sourced or see the tools it feeds.

How a session on the platform actually goes

No integrations are required. Choose a ticker, review the organised data, and follow the same research sequence each session.

  1. Step 1

    Set up your watchlist

    Pick the tickers you follow and the thresholds worth being told about. It takes a few minutes and there is nothing to install or connect.

  2. Step 2

    Watch the flow during the session

    Weighted net flow, the heat grid and the tape update continuously while US markets are open. Trial accounts see the same screens on a 15-minute delay.

  3. Step 3

    Check an observation against context

    Before drawing a conclusion, cross-check the observed activity against strike-level exposure, open interest, the trend over recent weeks and the news on that ticker.