


Underlying Pulse
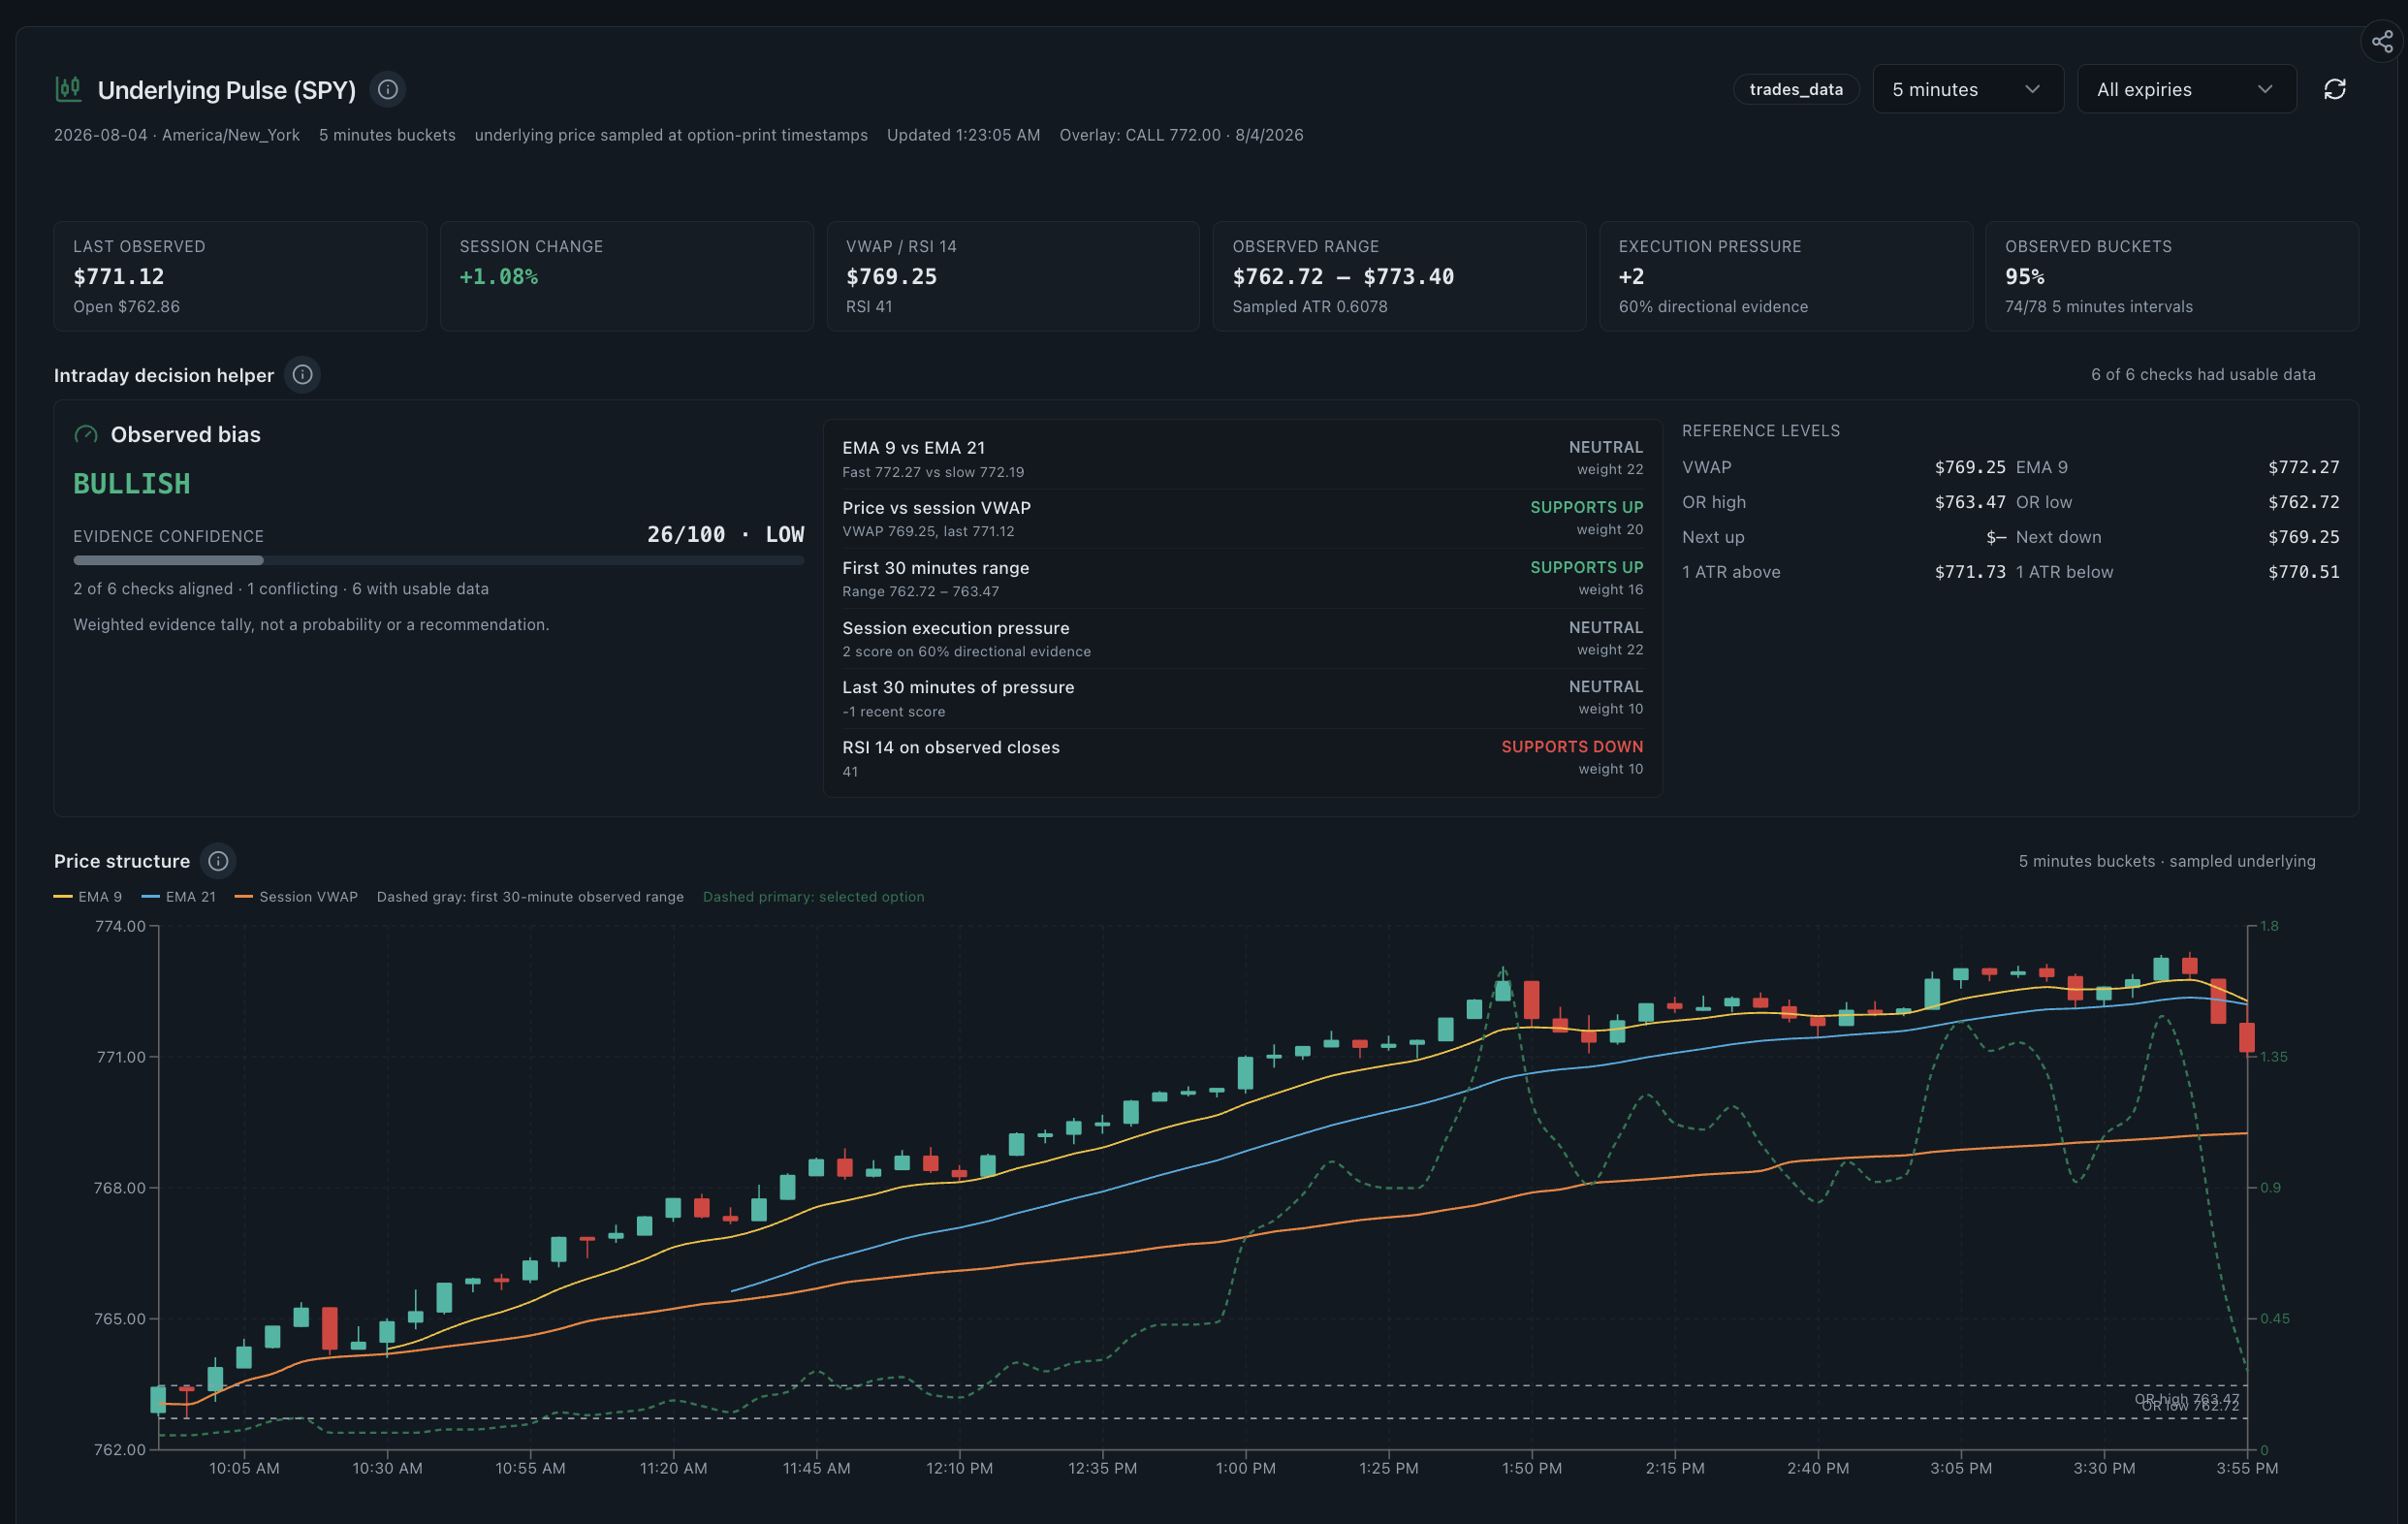
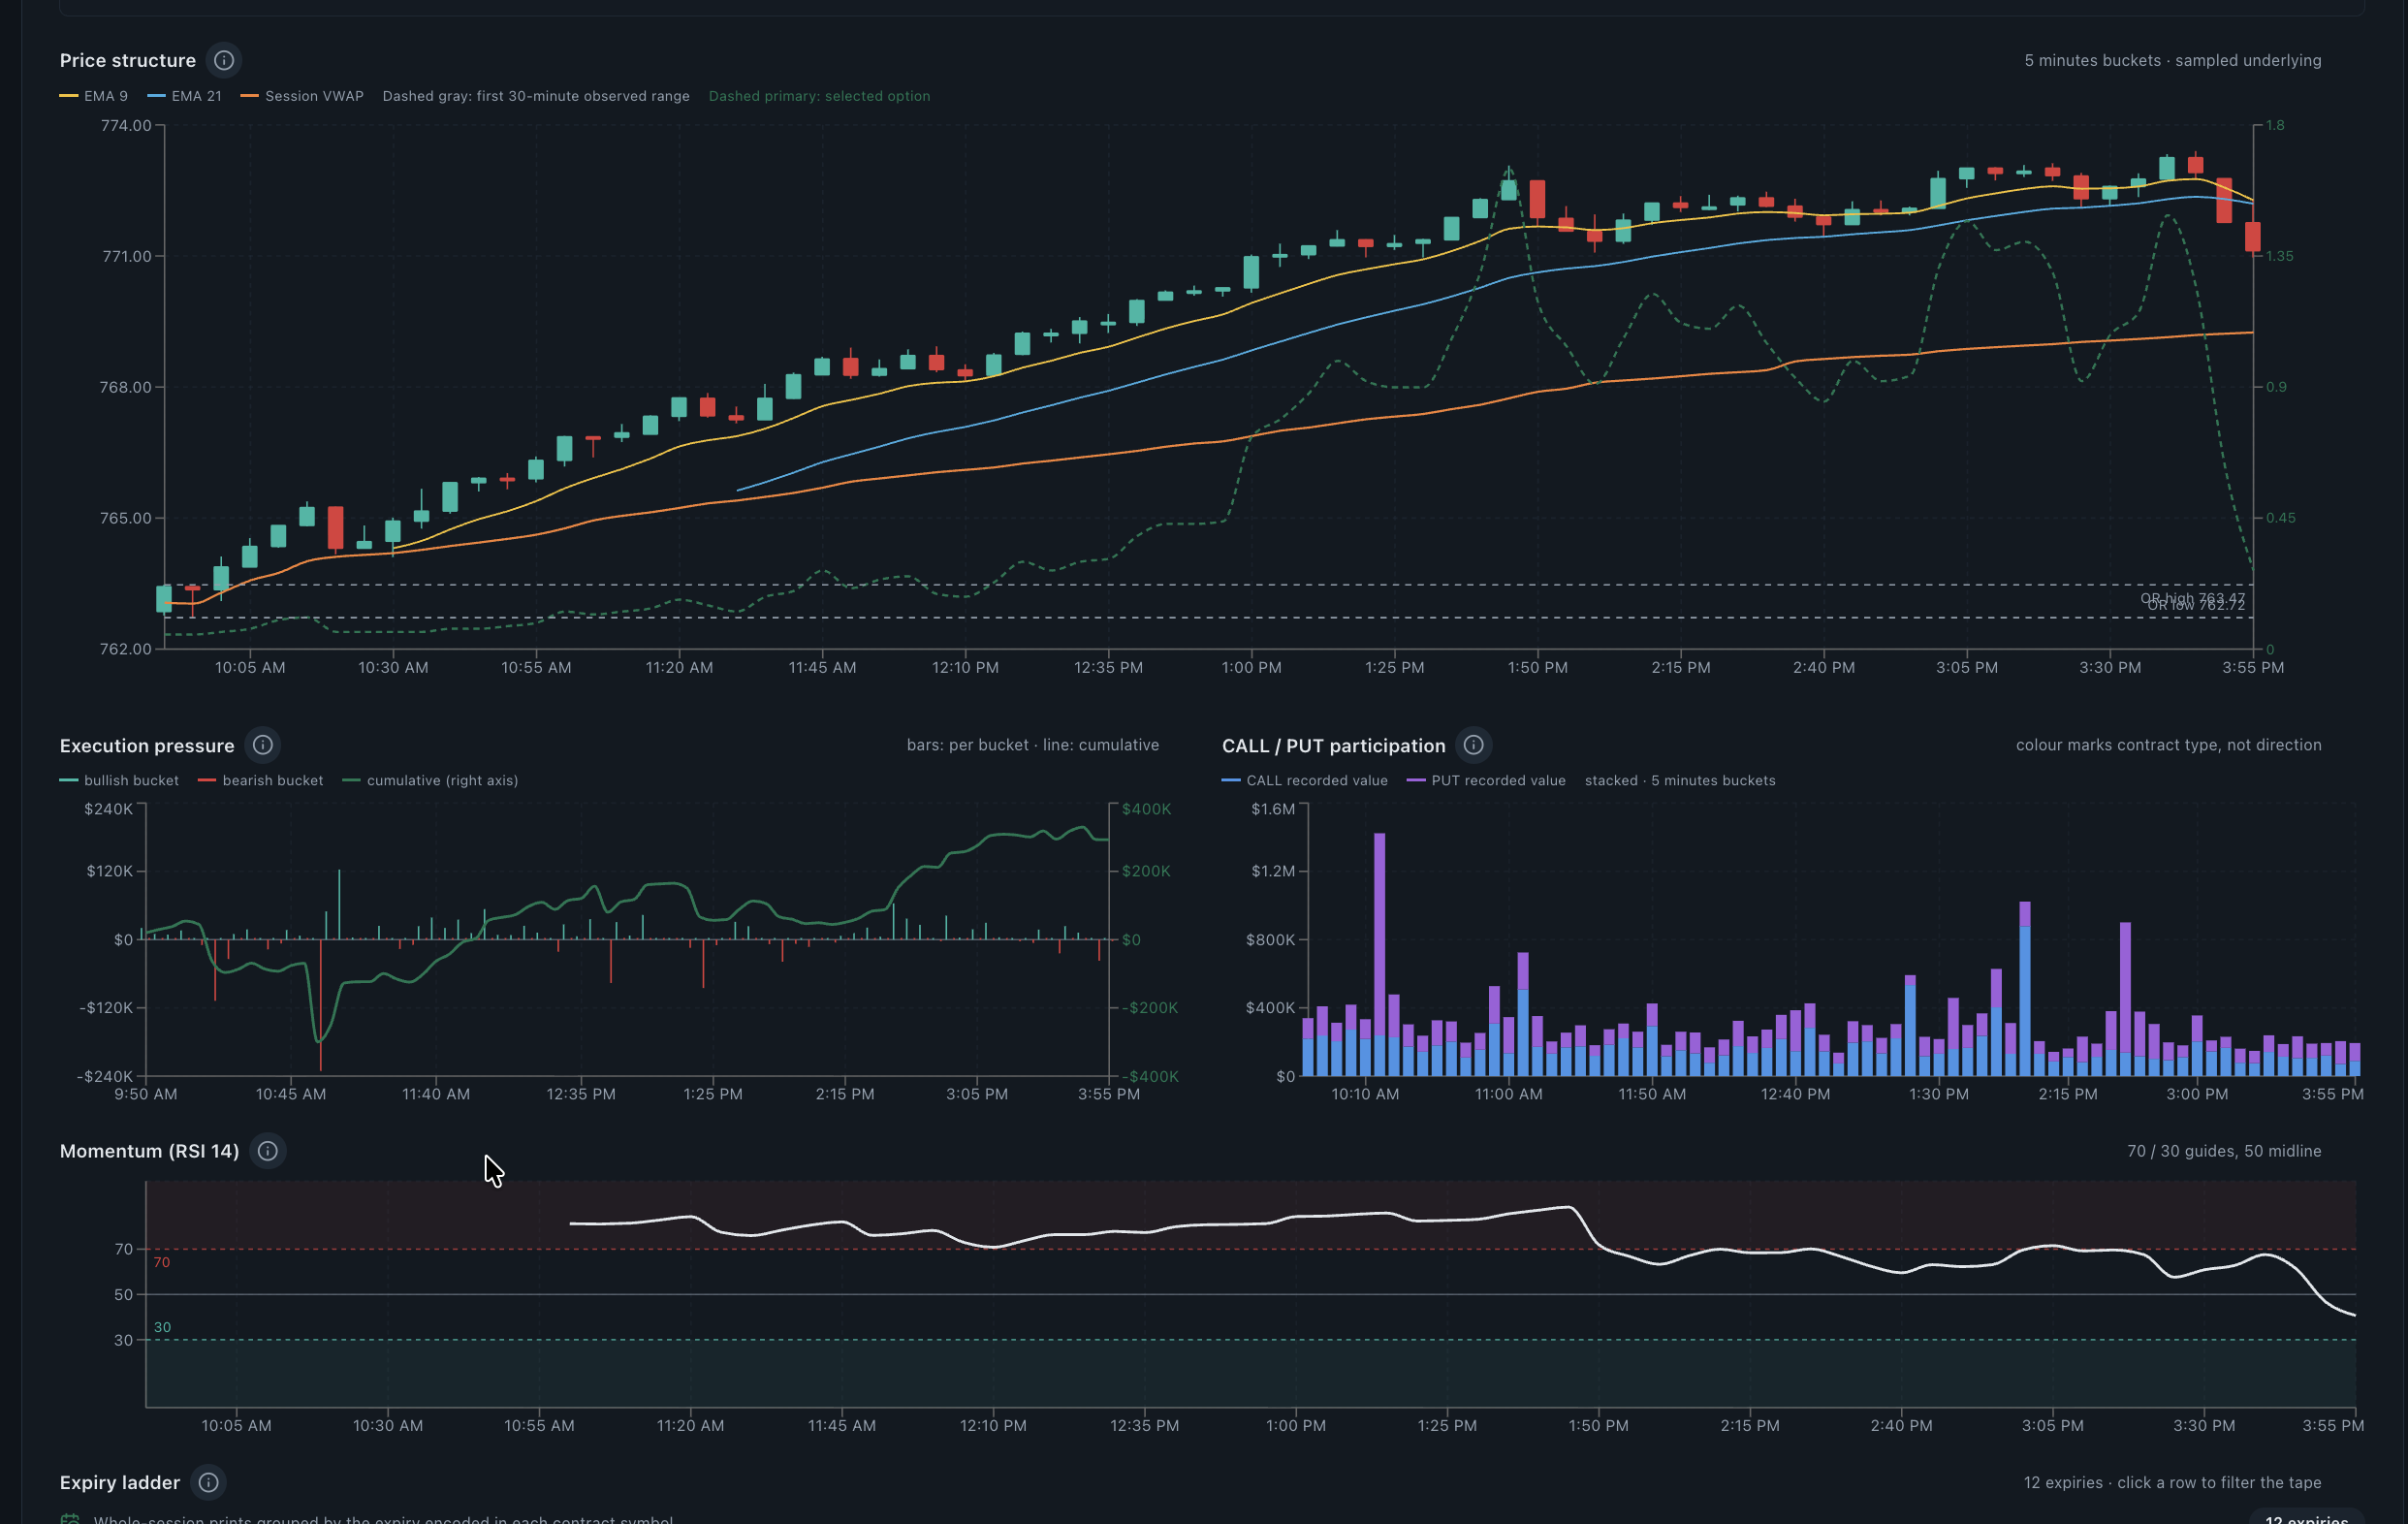
Underlying Pulse aligns sampled intraday price, VWAP, moving averages, RSI, execution pressure, call and put participation and expiry concentration on a shared time axis. It helps test whether an options-flow interpretation agrees with the underlying market; its observed-bias score remains a weighted diagnostic, not a recommendation.
- Research question
- Does options activity agree with intraday price structure?
- Best used for
- Checking whether options activity agrees with intraday price
- Data timing
- Near-real-time Pro; 15-minute delayed trial
- Product access
- Included in the single $29/month plan
What the underlying pulse shows
The view is built for confirmation and contradiction. A price move can be compared with execution pressure and participation without pretending that one indicator explains the whole session, and the usable-data count shows when the score rests on incomplete evidence.
Read the supporting context
The screenshot above is from the working product, not a mockup. The visible controls and fields are the same ones trial and Pro users research with; only the market-data timing changes between the two access levels.
- Intraday candles sampled at option-print timestamps.
- Fast and slow moving averages, session VWAP and first-30-minute range.
- Weighted evidence checks with visible agreement, conflict and usable-data counts.
- Per-bucket and cumulative estimated execution pressure.
- Call and put recorded value, RSI and expiry ladder on the same session.
How to read this dashboard
Read the dashboard as one step in a sequence. Record what it directly shows first, then use the next view to test the interpretation rather than turning a color or ranking into a conclusion.
- Confirm the date, timezone, bucket interval and observed-data coverage.
- Read price relative to VWAP and the opening range before looking at the bias label.
- Inspect which evidence checks support, oppose or remain neutral.
- Compare execution-pressure turns with price and call/put participation on the same timestamps.
- Use expiry detail and a selected contract to continue the investigation.
What this view cannot establish
VWAP, moving averages and RSI describe past prices, while execution-pressure classification is estimated from recorded quotes. Sampling at option-print timestamps can omit periods with little qualifying activity.
Read the supporting context
Realtime Options organises observed and derived market data for independent research. Read each view with its stated method, assumptions and surrounding context.
Common questions
What does Underlying Pulse combine?
It combines sampled intraday price structure, VWAP, moving averages, RSI, estimated execution pressure, call-and-put participation and expiry context.
Is the observed-bias label a buy or sell signal?
No. It is a weighted summary of defined evidence checks. The supporting, conflicting and neutral checks remain visible for independent review.
Why sample price at option-print timestamps?
That alignment lets price and qualifying options activity be compared on a shared clock, but it can omit quiet intervals and is disclosed as sampled data.