


How to read options flow
Read options flow from broad to narrow: establish the market backdrop, choose a ticker, inspect the contract, classify the execution, compare volume with open interest, and check price and catalysts. This order matters because a single large print is emotionally vivid but analytically incomplete.
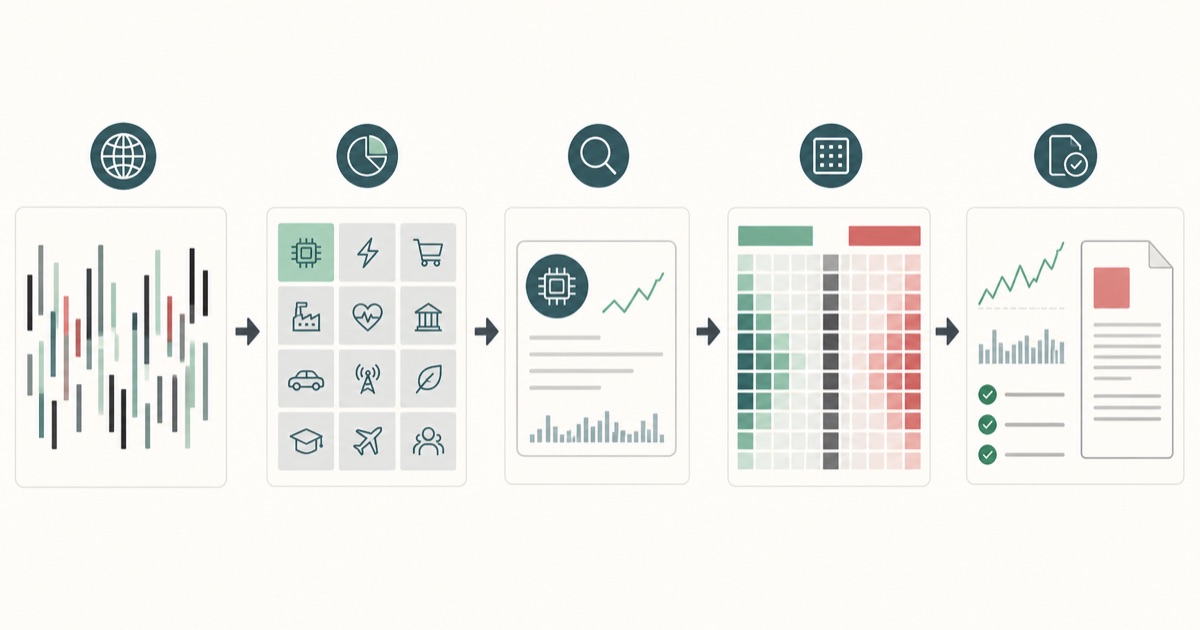
- Start
- Market-wide call and put pressure
- Then
- Sector, ticker, strike and expiry
- Verify
- Execution, price, open interest and news
- Stop
- When evidence conflicts; do not force a story
1-2. Establish the market and ticker backdrop
Begin with market-wide weighted flow and the underlying index price. A bullish-looking single-stock print inside a put-heavy, falling market has a different backdrop from the same print during broad call pressure.
Read the supporting context
Next compare sectors and ticker rankings. Prefer names with repeated or related activity over a single isolated leaderboard appearance.
3-4. Inspect the contract and execution
Record call or put, strike, expiry, size and premium before using a directional label. Moneyness and time to expiration change both the cost and sensitivity of the contract.
Read the supporting context
Then compare the execution with the bid, midpoint and ask. Treat the result as an estimate of aggressor direction, especially when the trade sits at the midpoint or nearby prints suggest a spread.
5-6. Check positioning, price and catalyst
Compare current volume with published open interest and wait for the next open-interest update before claiming a new position. High volume with unchanged open interest can reflect closing or transferred positions.
Read the supporting context
Finish with underlying price, repeat flow and timestamped news. If they disagree, preserve the disagreement. A research process is working when it prevents an unsupported conclusion, not only when it produces one.
Common questions
What should I look at first in options flow?
Start with market-wide call and put pressure beside the underlying price. This creates the context for any ticker-specific activity that follows.
How do I know if an options trade is opening?
You usually cannot know intraday with certainty from a public print. Compare volume with prior open interest, then inspect the next published open-interest change while allowing for transfers and multi-leg positions.
What if price disagrees with options flow?
Treat the divergence as unresolved evidence. It may reflect hedging, closing activity, timing differences or an incomplete classification rather than an opportunity that must converge.