


Market News Context dashboard
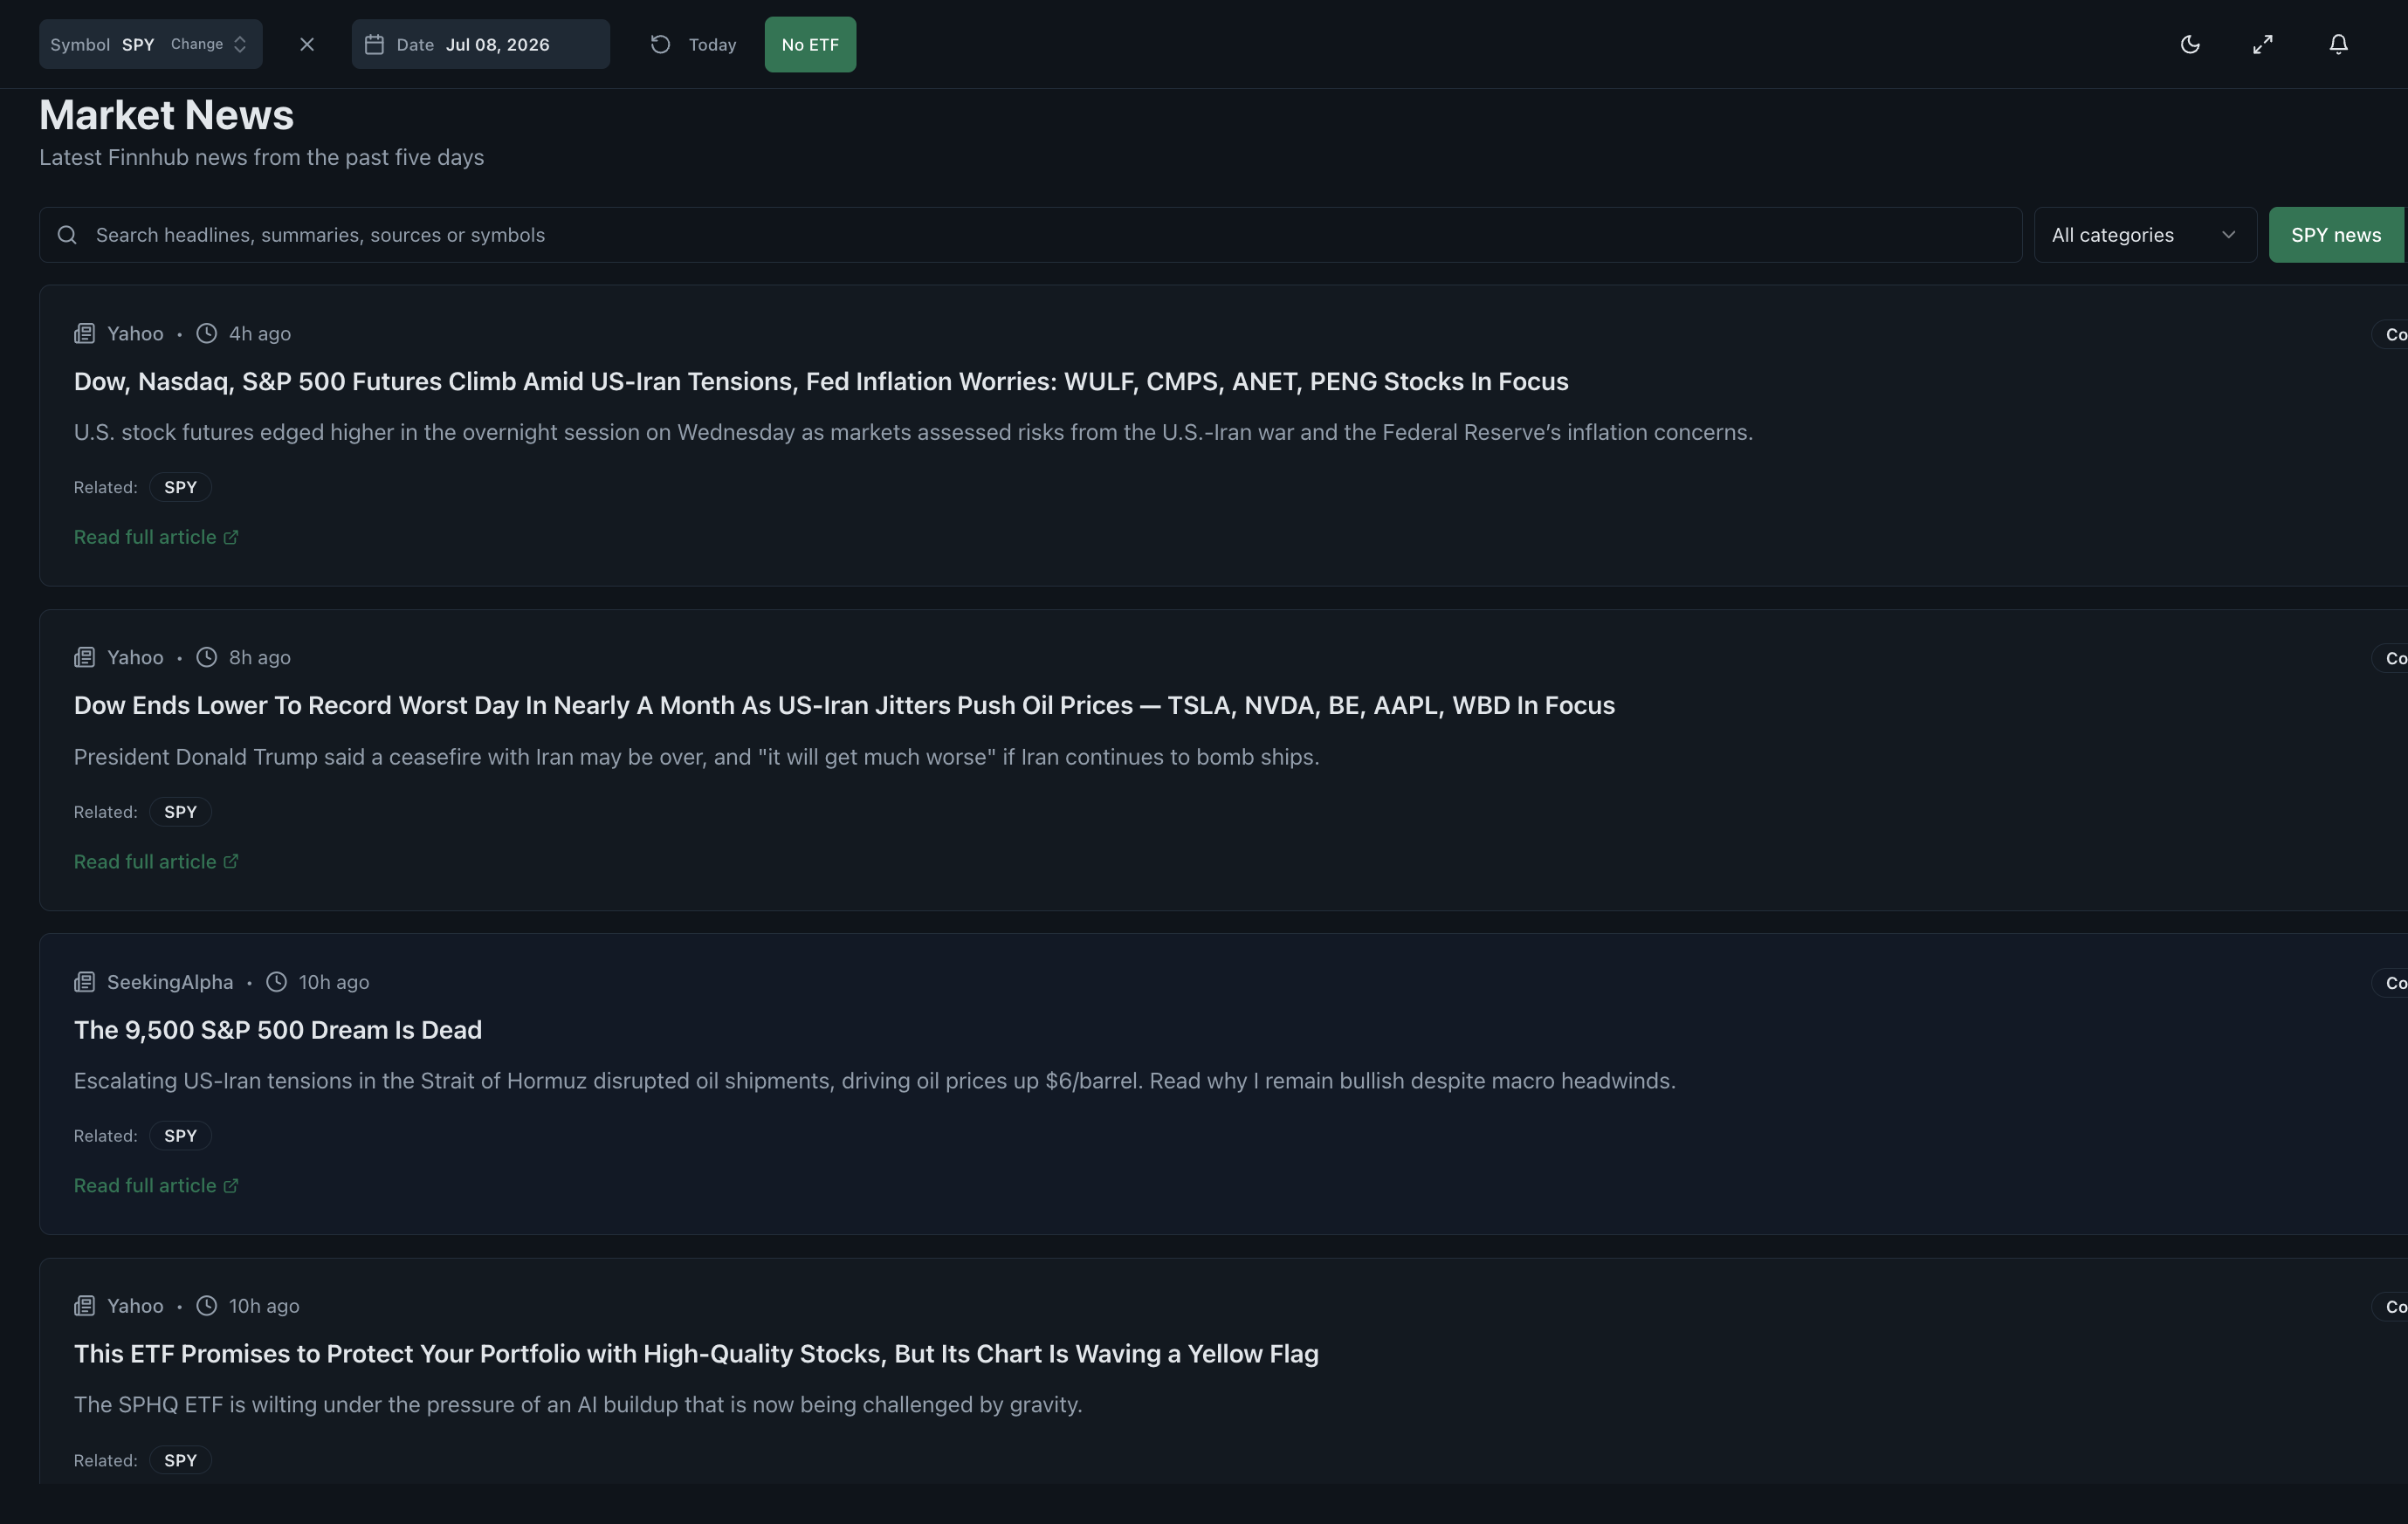
The Market News Context dashboard filters recent headlines by ticker, source and category so options activity can be checked against reported catalysts. It does not score headlines or predict their price impact; it helps a researcher avoid inventing a story when a scheduled or public explanation already exists.
- Research question
- What public catalyst could explain the options activity?
- Best used for
- Checking flow against timestamped company and market news
- Data timing
- Near-real-time Pro; 15-minute delayed trial
- Product access
- Included in the single $29/month plan
What the market news context dashboard shows
News belongs after the market and contract evidence, not before it. Checking a timestamped source can explain why activity increased, but it can also show that a tempting narrative appeared only after the market had already moved.
Read the supporting context
The screenshot above is from the working product, not a mockup. The visible controls and fields are the same ones trial and Pro users research with; only the market-data timing changes between the two access levels.
- Ticker-filtered market and company headlines.
- Search and category controls for narrowing the result set.
- Source and publication time for each item.
- Recent cached coverage rather than an unbounded news archive.
How to read this dashboard
Read the dashboard as one step in a sequence. Record what it directly shows first, then use the next view to test the interpretation rather than turning a color or ranking into a conclusion.
- Filter to the ticker before reading a broad market headline as a cause.
- Compare the publication time with the first unusual flow and the price move.
- Separate scheduled catalysts such as earnings from unscheduled reports.
- Open the original source before relying on a headline summary.
What this view cannot establish
Temporal proximity does not establish causation, headlines can omit material nuance and the absence of a public article does not make a trade informed. The dashboard is context retrieval, not news sentiment or event prediction.
Read the supporting context
Realtime Options organises observed and derived market data for independent research. Read each view with its stated method, assumptions and surrounding context.
Common questions
Why include news in an options flow platform?
A reported catalyst can explain unusual premium, volatility or ticker attention. Checking it reduces the risk of treating scheduled activity as mysterious informed trading.
Does the news dashboard rate headlines as bullish or bearish?
No. It provides filters, timestamps and source context. The platform does not turn headlines into trade recommendations.
Can a headline prove why an options trade occurred?
No. It can supply relevant timing and context, but trade purpose and beneficial ownership remain unknown from public data.