


Contract Positioning dashboard
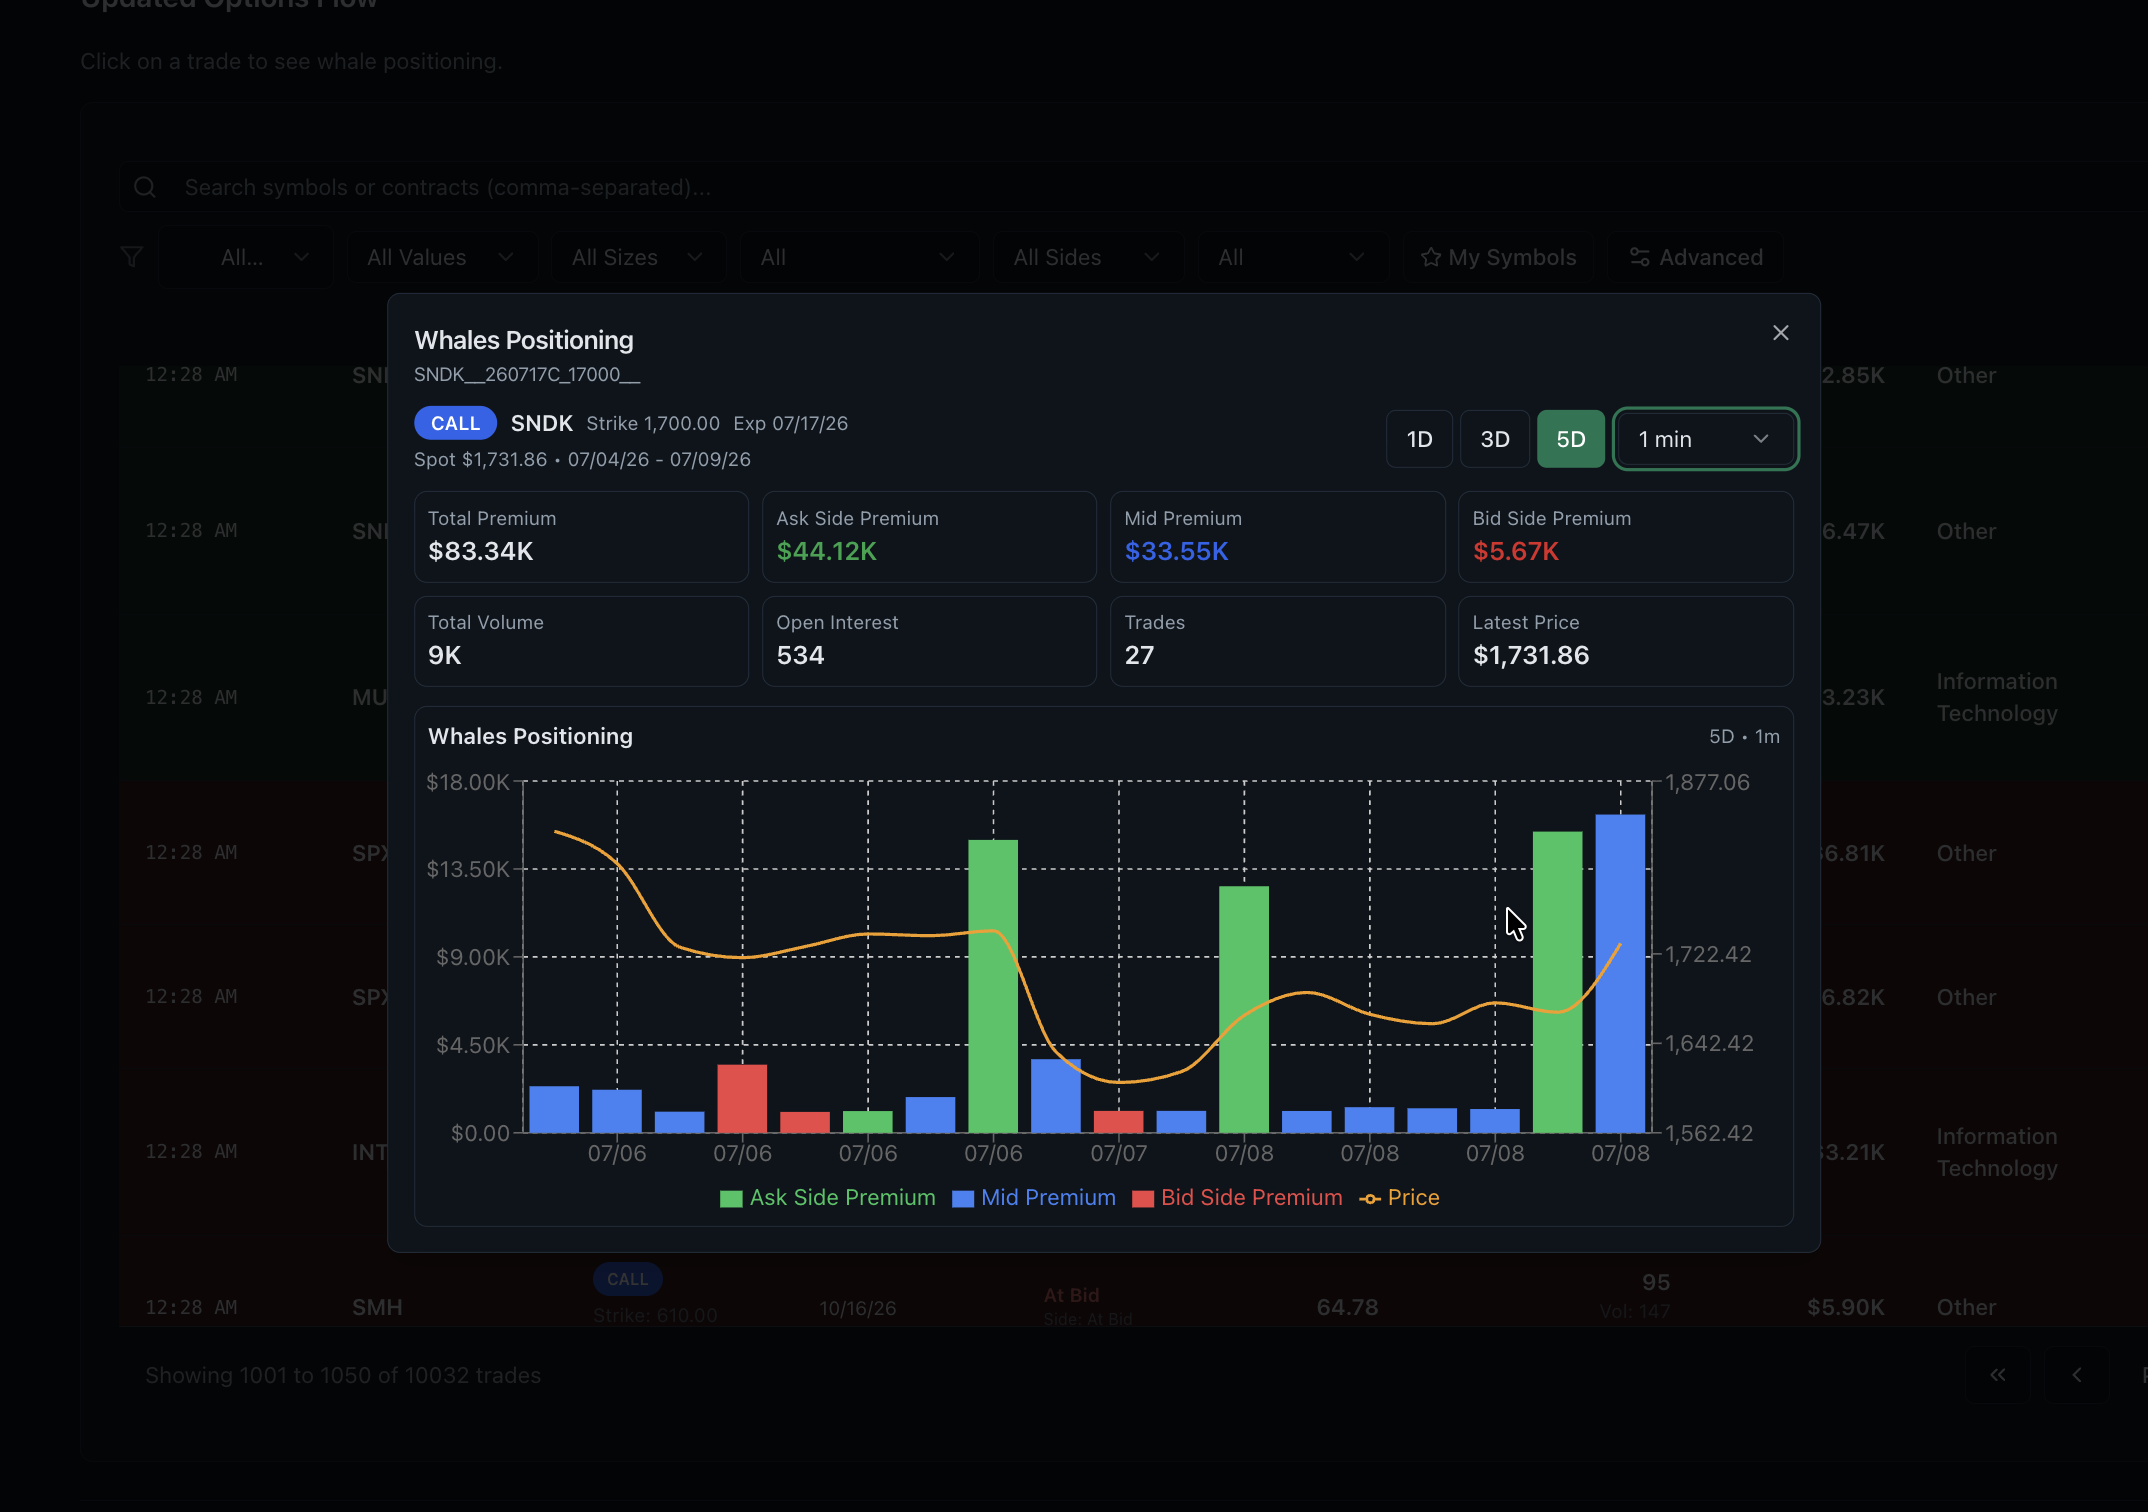
Contract Positioning is a history view for large or notable options activity. It separates estimated ask-, mid- and bid-side premium over time and places those series beside contract price, volume, open interest and trade count so one print can be studied as part of a sequence.
- Research question
- What happened around a large contract after it appeared?
- Best used for
- Studying one contract rather than a market-wide ranking
- Data timing
- Near-real-time Pro; 15-minute delayed trial
- Product access
- Included in the single $29/month plan
What the contract positioning dashboard shows
The screen is designed to slow down a large-print alert. Splitting premium by execution location and adding a timeline makes it easier to see whether activity repeated, reversed or remained isolated.
Read the supporting context
The screenshot above is from the working product, not a mockup. The visible controls and fields are the same ones trial and Pro users research with; only the market-data timing changes between the two access levels.
- Ask-side, mid-market and bid-side premium plotted separately.
- Contract price and underlying context across the same window.
- Volume, trade count and published open interest.
- One-, three- and five-day views for short historical comparison.
How to read this dashboard
Read the dashboard as one step in a sequence. Record what it directly shows first, then use the next view to test the interpretation rather than turning a color or ranking into a conclusion.
- Check whether premium concentrated at the ask, bid or midpoint.
- Compare total volume with trade count to identify one block versus many trades.
- Review contract price and underlying price after the initial event.
- Use the next open-interest update and news context before describing the position as opening or directional.
What this view cannot establish
Public prints do not identify a beneficial owner or reveal every leg of a spread. Ask-side activity can be hedged or closing, and midpoint activity often reflects negotiated or multi-leg structures.
Read the supporting context
Realtime Options organises observed and derived market data for independent research. Read each view with its stated method, assumptions and surrounding context.
Common questions
What counts as a large options transaction?
It is an options print with unusually large premium or contract size relative to the surrounding activity. Size alone does not explain its wider position context.
Why separate ask, mid and bid premium?
Execution location can estimate who crossed the spread more aggressively. It is useful context, but it cannot prove trade intent or expose hidden spread legs.
Is open interest live in this dashboard?
No. Open interest is calculated after clearing and published for the next session. Intraday views use the latest available figure.