


Open Interest Lens
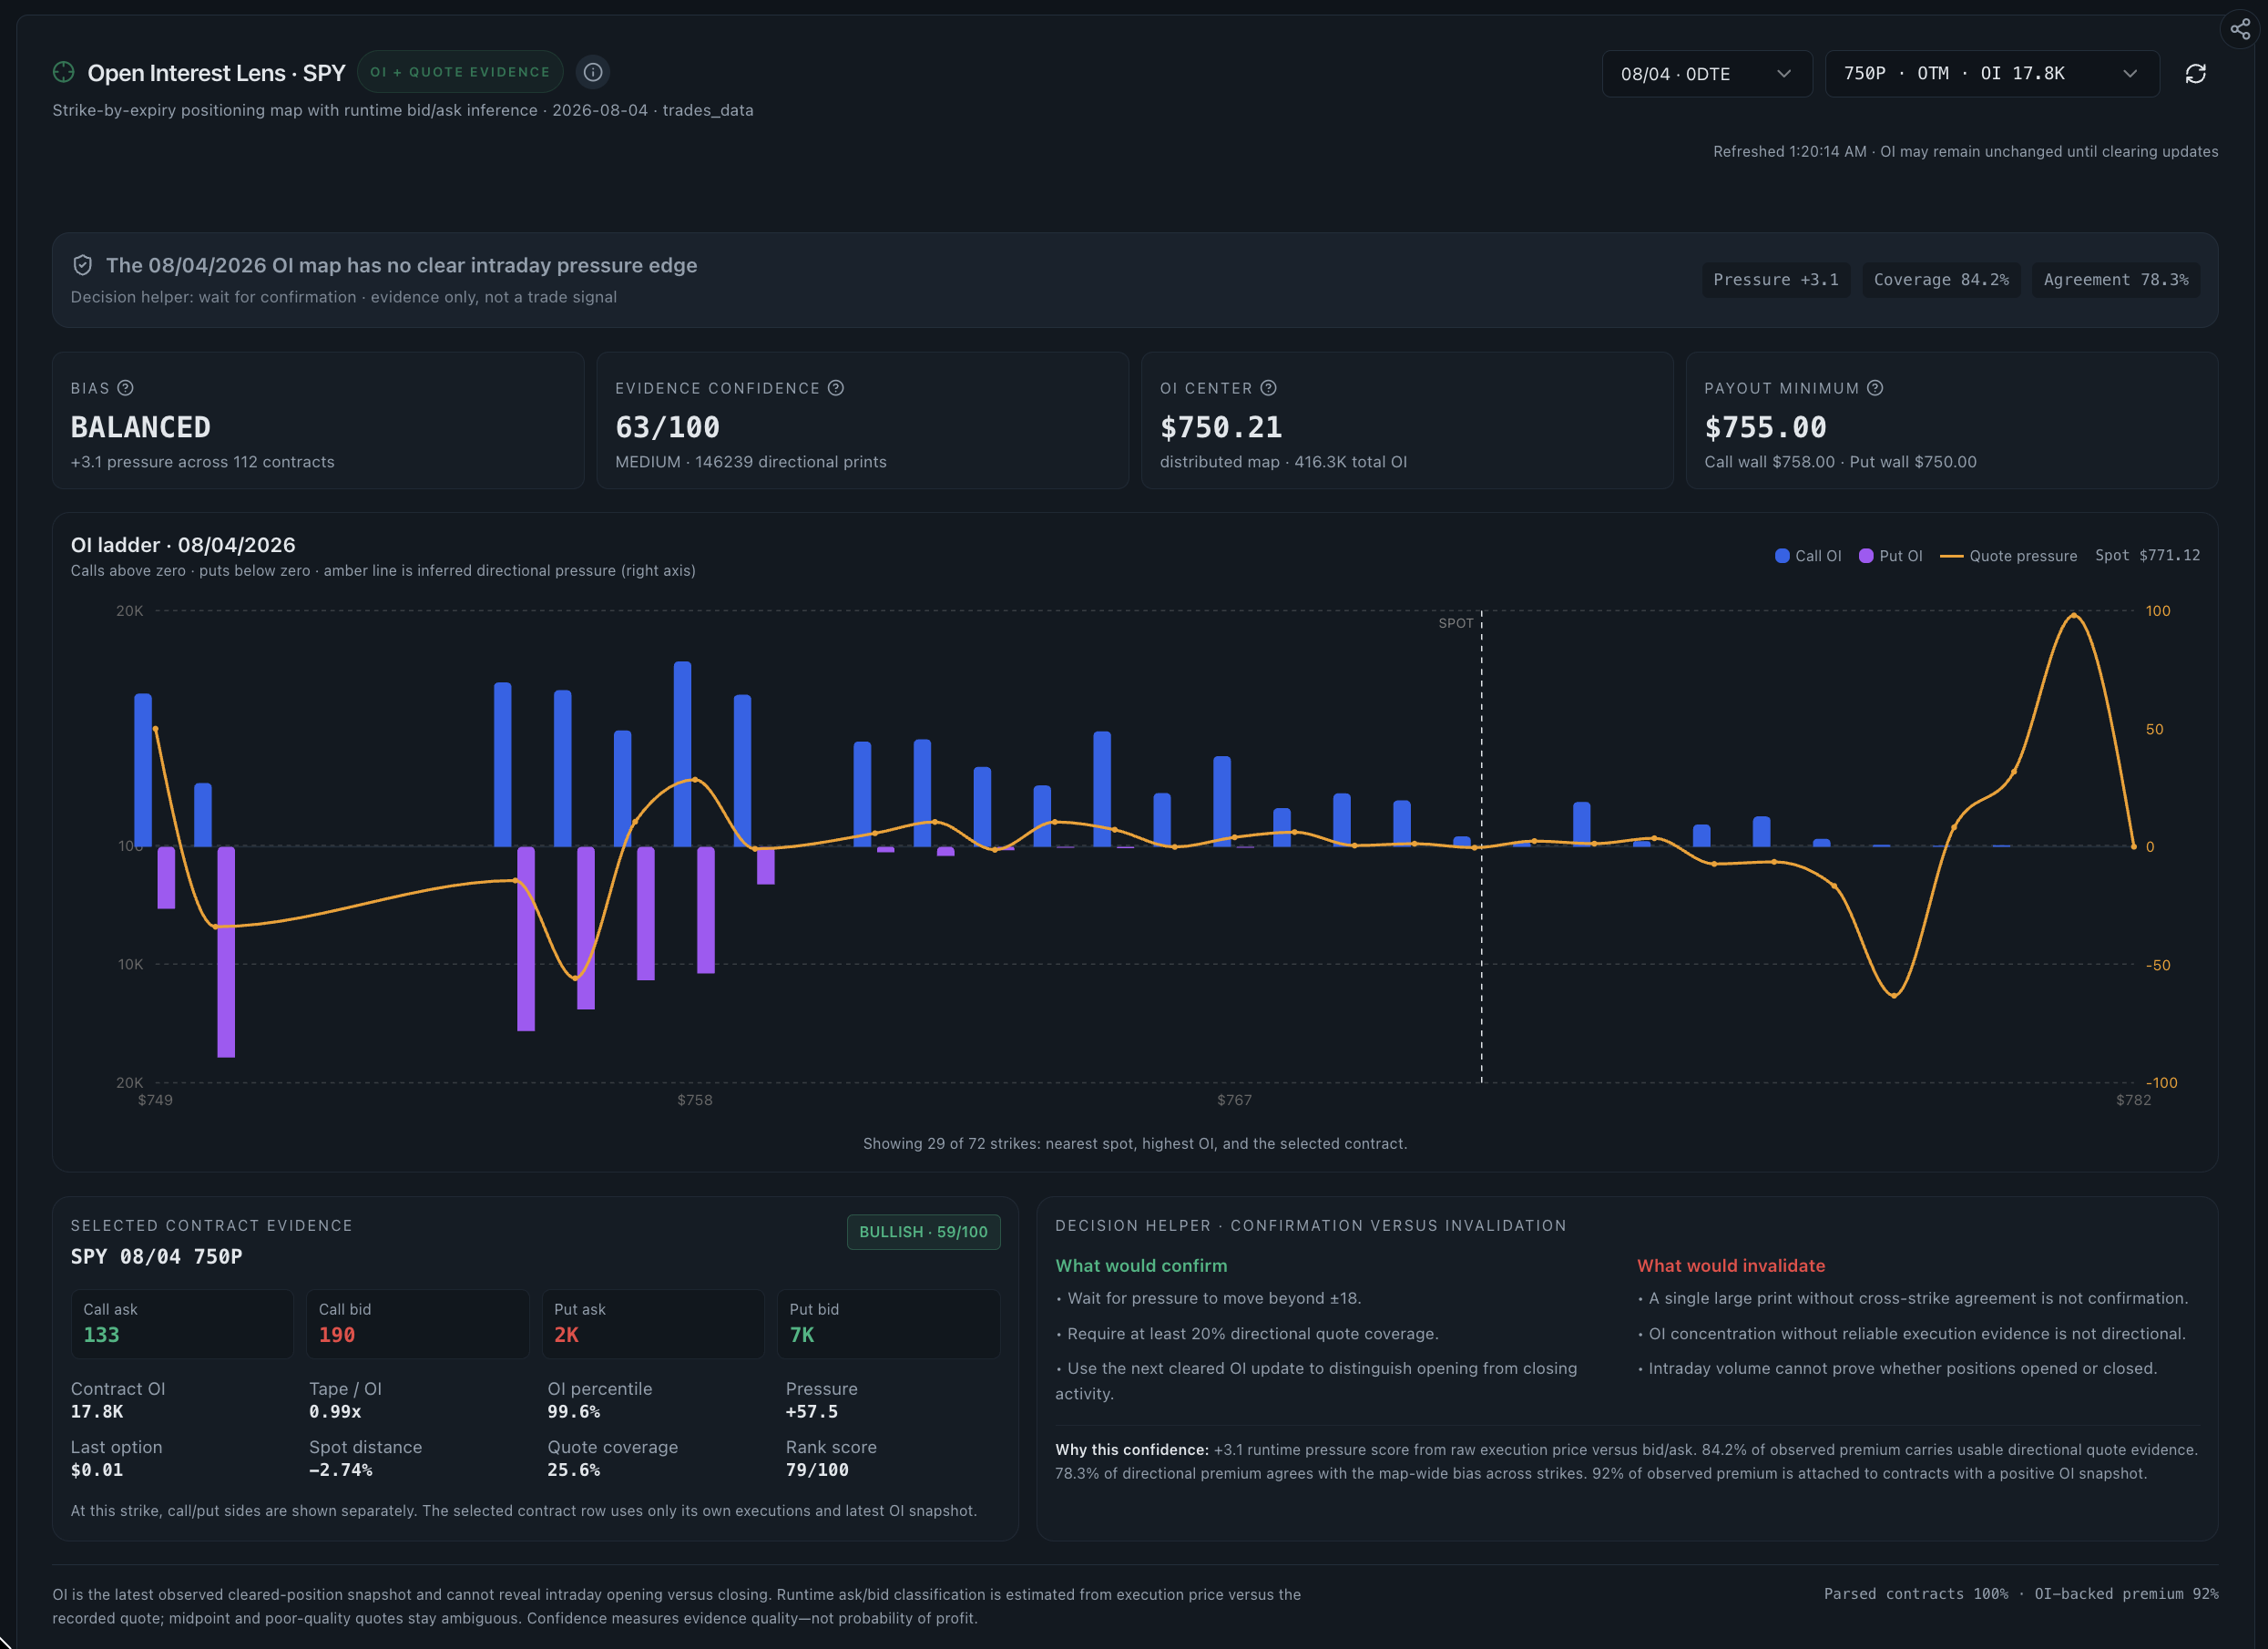
Open Interest Lens maps the latest cleared call and put open-interest snapshot by strike and overlays runtime quote-side execution evidence for a selected expiry and contract. It helps separate existing positioning from current-session pressure while stating when the evidence is balanced, incomplete or contradictory.
- Research question
- How does current execution relate to cleared open interest?
- Best used for
- Comparing cleared positioning with current-session execution
- Data timing
- Near-real-time Pro; 15-minute delayed trial
- Product access
- Included in the single $29/month plan
What the open interest lens shows
The view joins two clocks: open interest from the latest clearing cycle and runtime executions from the current session. The explicit coverage, agreement and confirmation fields make missing or conflicting evidence visible instead of hiding it behind one directional color.
Read the supporting context
The screenshot above is from the working product, not a mockup. The visible controls and fields are the same ones trial and Pro users research with; only the market-data timing changes between the two access levels.
- Call open interest above the axis and put open interest below it by strike.
- Quote-pressure overlay inferred from executions relative to recorded bid and ask.
- Coverage and agreement measures that expose how much usable evidence supports the score.
- Selected-contract fields including open interest, tape-to-OI ratio and spot distance.
- Separate confirmation and invalidation prompts for a documented research note.
How to read this dashboard
Read the dashboard as one step in a sequence. Record what it directly shows first, then use the next view to test the interpretation rather than turning a color or ranking into a conclusion.
- Confirm the expiry, strike and latest open-interest snapshot date.
- Locate call and put concentration around spot before reading the pressure line.
- Check coverage and agreement before using the evidence score.
- Read the selected contract separately from the map-wide result.
- Wait for the next cleared open-interest update before describing activity as opening or closing.
What this view cannot establish
Each open contract has both a long and a short side, and public executions do not reveal the beneficial owner or complete hedge. Quote-side classification can also remain ambiguous when trades occur near the midpoint or quotes are poor quality.
Read the supporting context
Realtime Options organises observed and derived market data for independent research. Read each view with its stated method, assumptions and surrounding context.
Common questions
Is Open Interest Lens showing live open interest?
No. Open interest is the latest available cleared daily snapshot. Runtime execution evidence is displayed separately so the two data clocks are not confused.
What does evidence confidence mean in Open Interest Lens?
It summarises the quality and agreement of the available execution evidence. It is not a probability that a contract or price direction will be profitable.
Can the view prove that a position was opened intraday?
No. The next official open-interest update can add evidence, but a current-session tape cannot by itself prove opening versus closing activity.