


How to read an option chain
An option chain lists available call and put contracts for an underlying across strikes and expiration dates. Each row can include bid, ask, last price, volume, open interest, implied volatility and Greeks. Read expiry and strike first, then quote and activity fields, and only then move to modeled sensitivity or flow interpretation.
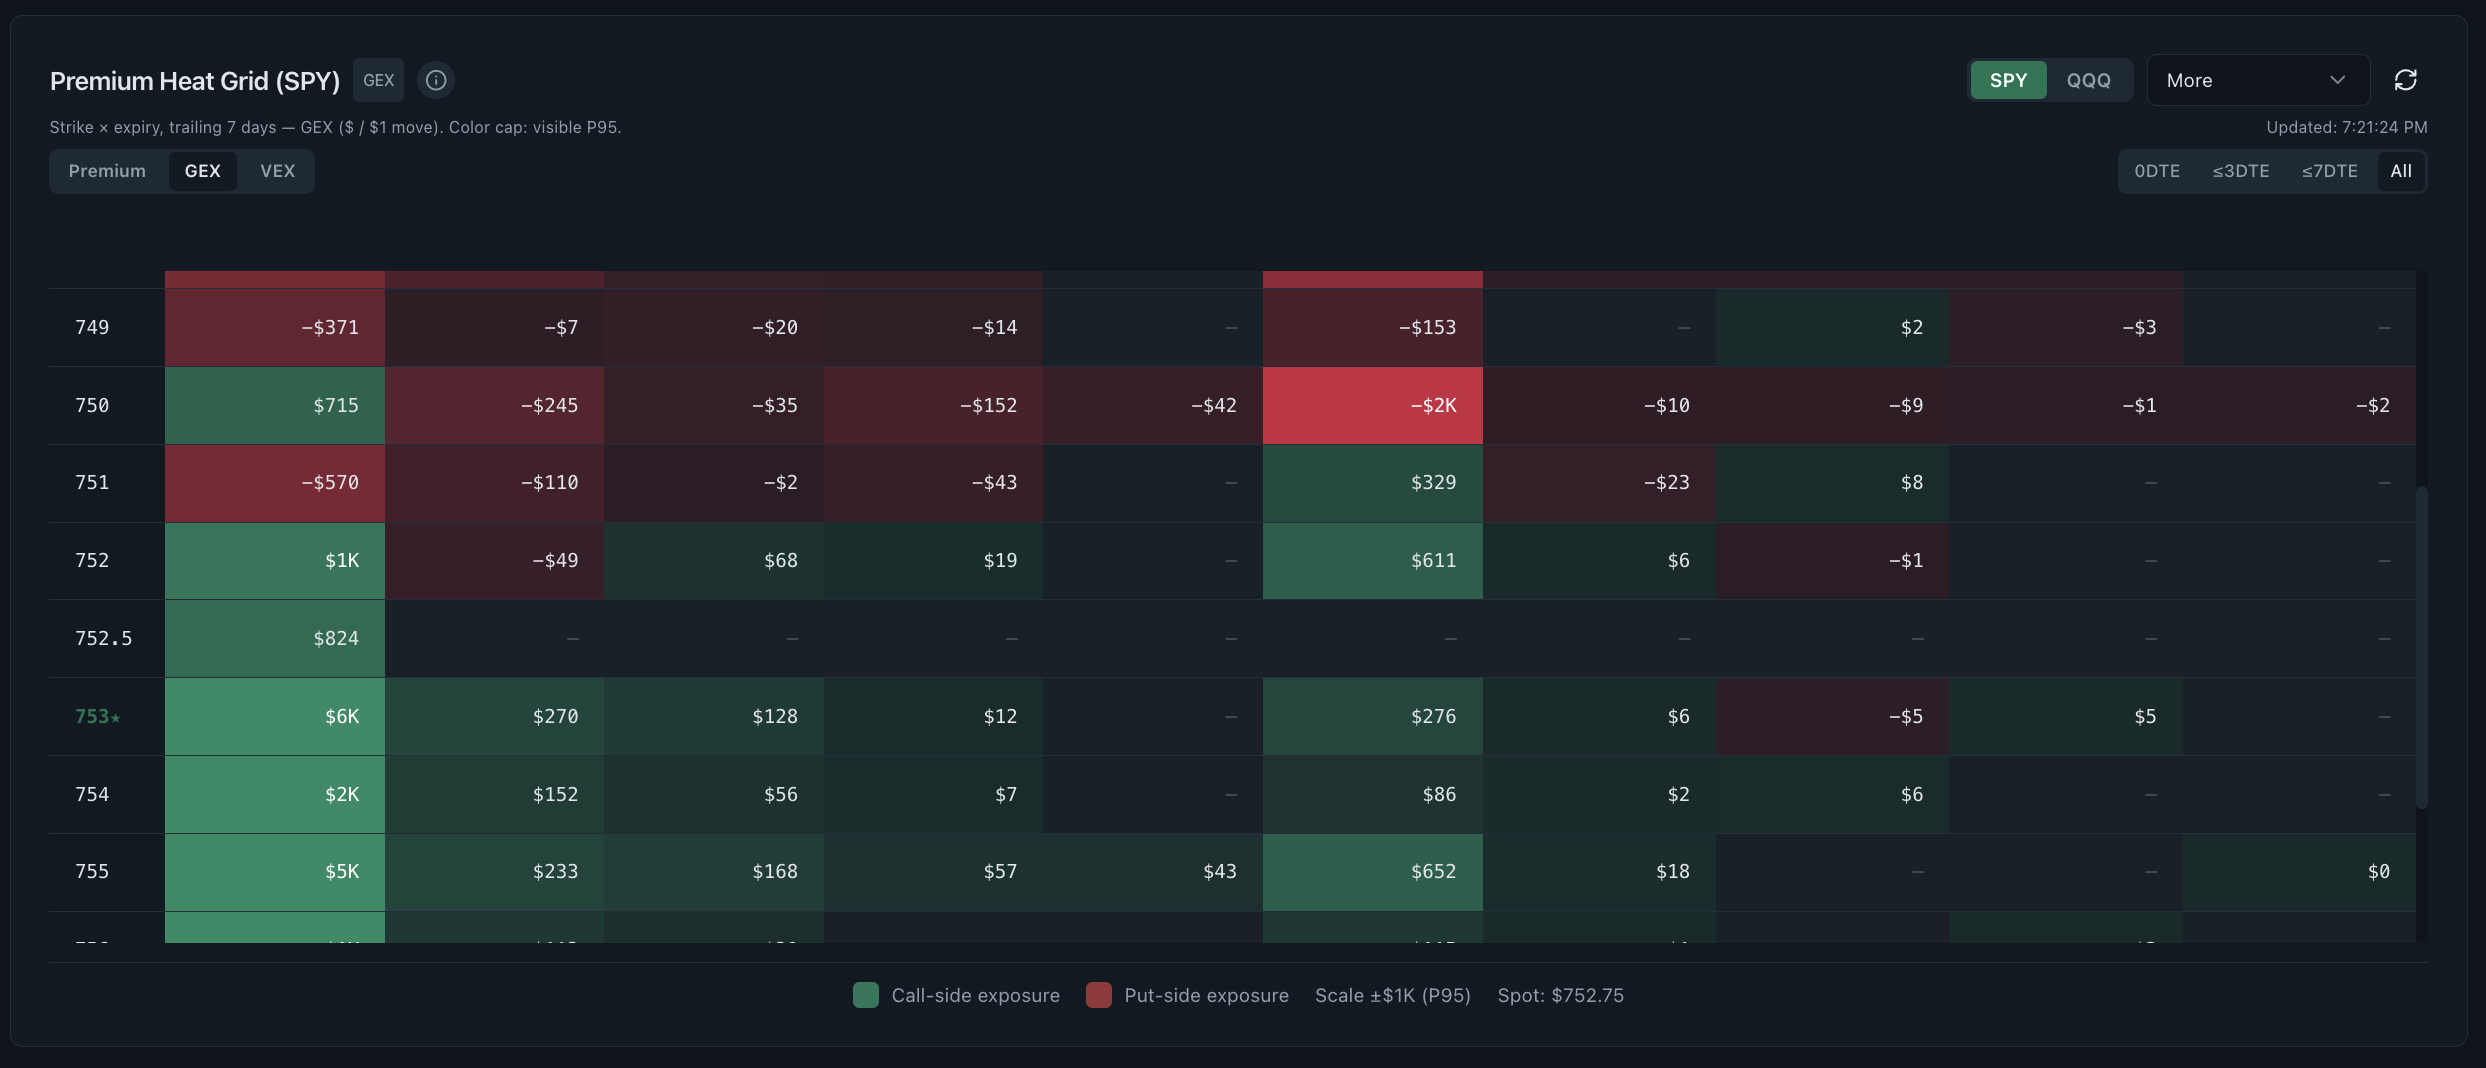
- Rows
- Strike prices within an expiration
- Sides
- Calls and puts
- Observed fields
- Bid, ask, last, volume and open interest
- Modeled fields
- Implied volatility and Greeks
1. Choose expiry and locate spot
Start with the expiration date because time remaining changes option value and Greek sensitivity. Then locate the underlying price relative to the strike ladder so in-, at- and out-of-the-money contracts are clear.
2. Read the quote and activity fields
Bid and ask show the current two-sided market; last price shows the most recent execution and can be stale. Volume counts today's contracts, while open interest is the latest post-clearing outstanding total.
Read the supporting context
A tight spread can matter more for execution than a large open-interest number, and high open interest does not guarantee the displayed size you need.
3. Add volatility, Greeks and flow
Implied volatility and Greeks are model outputs that help compare contracts with different strikes and expiries. Flow adds the timing, premium and estimated side of executed trades.
Read the supporting context
Realtime Options presents chain data as heat grids and strike charts rather than a broker order ticket. The goal is concentration and context, not execution.
Common questions
What is real-time option chain data?
It is the current set of contract quotes and activity fields organized by strike and expiration. Some fields update intraday, while open interest updates after clearing rather than in real time.
Does Realtime Options show a raw option chain?
No. It visualizes chain context through premium, exposure and open-interest heatmaps and strike charts. Use your broker for a live bid-and-ask order-entry chain.
Which option-chain field should I read first?
Choose the expiry and locate the underlying price relative to strikes before comparing quotes, volume, open interest, volatility or Greeks.