


Real time options quotes
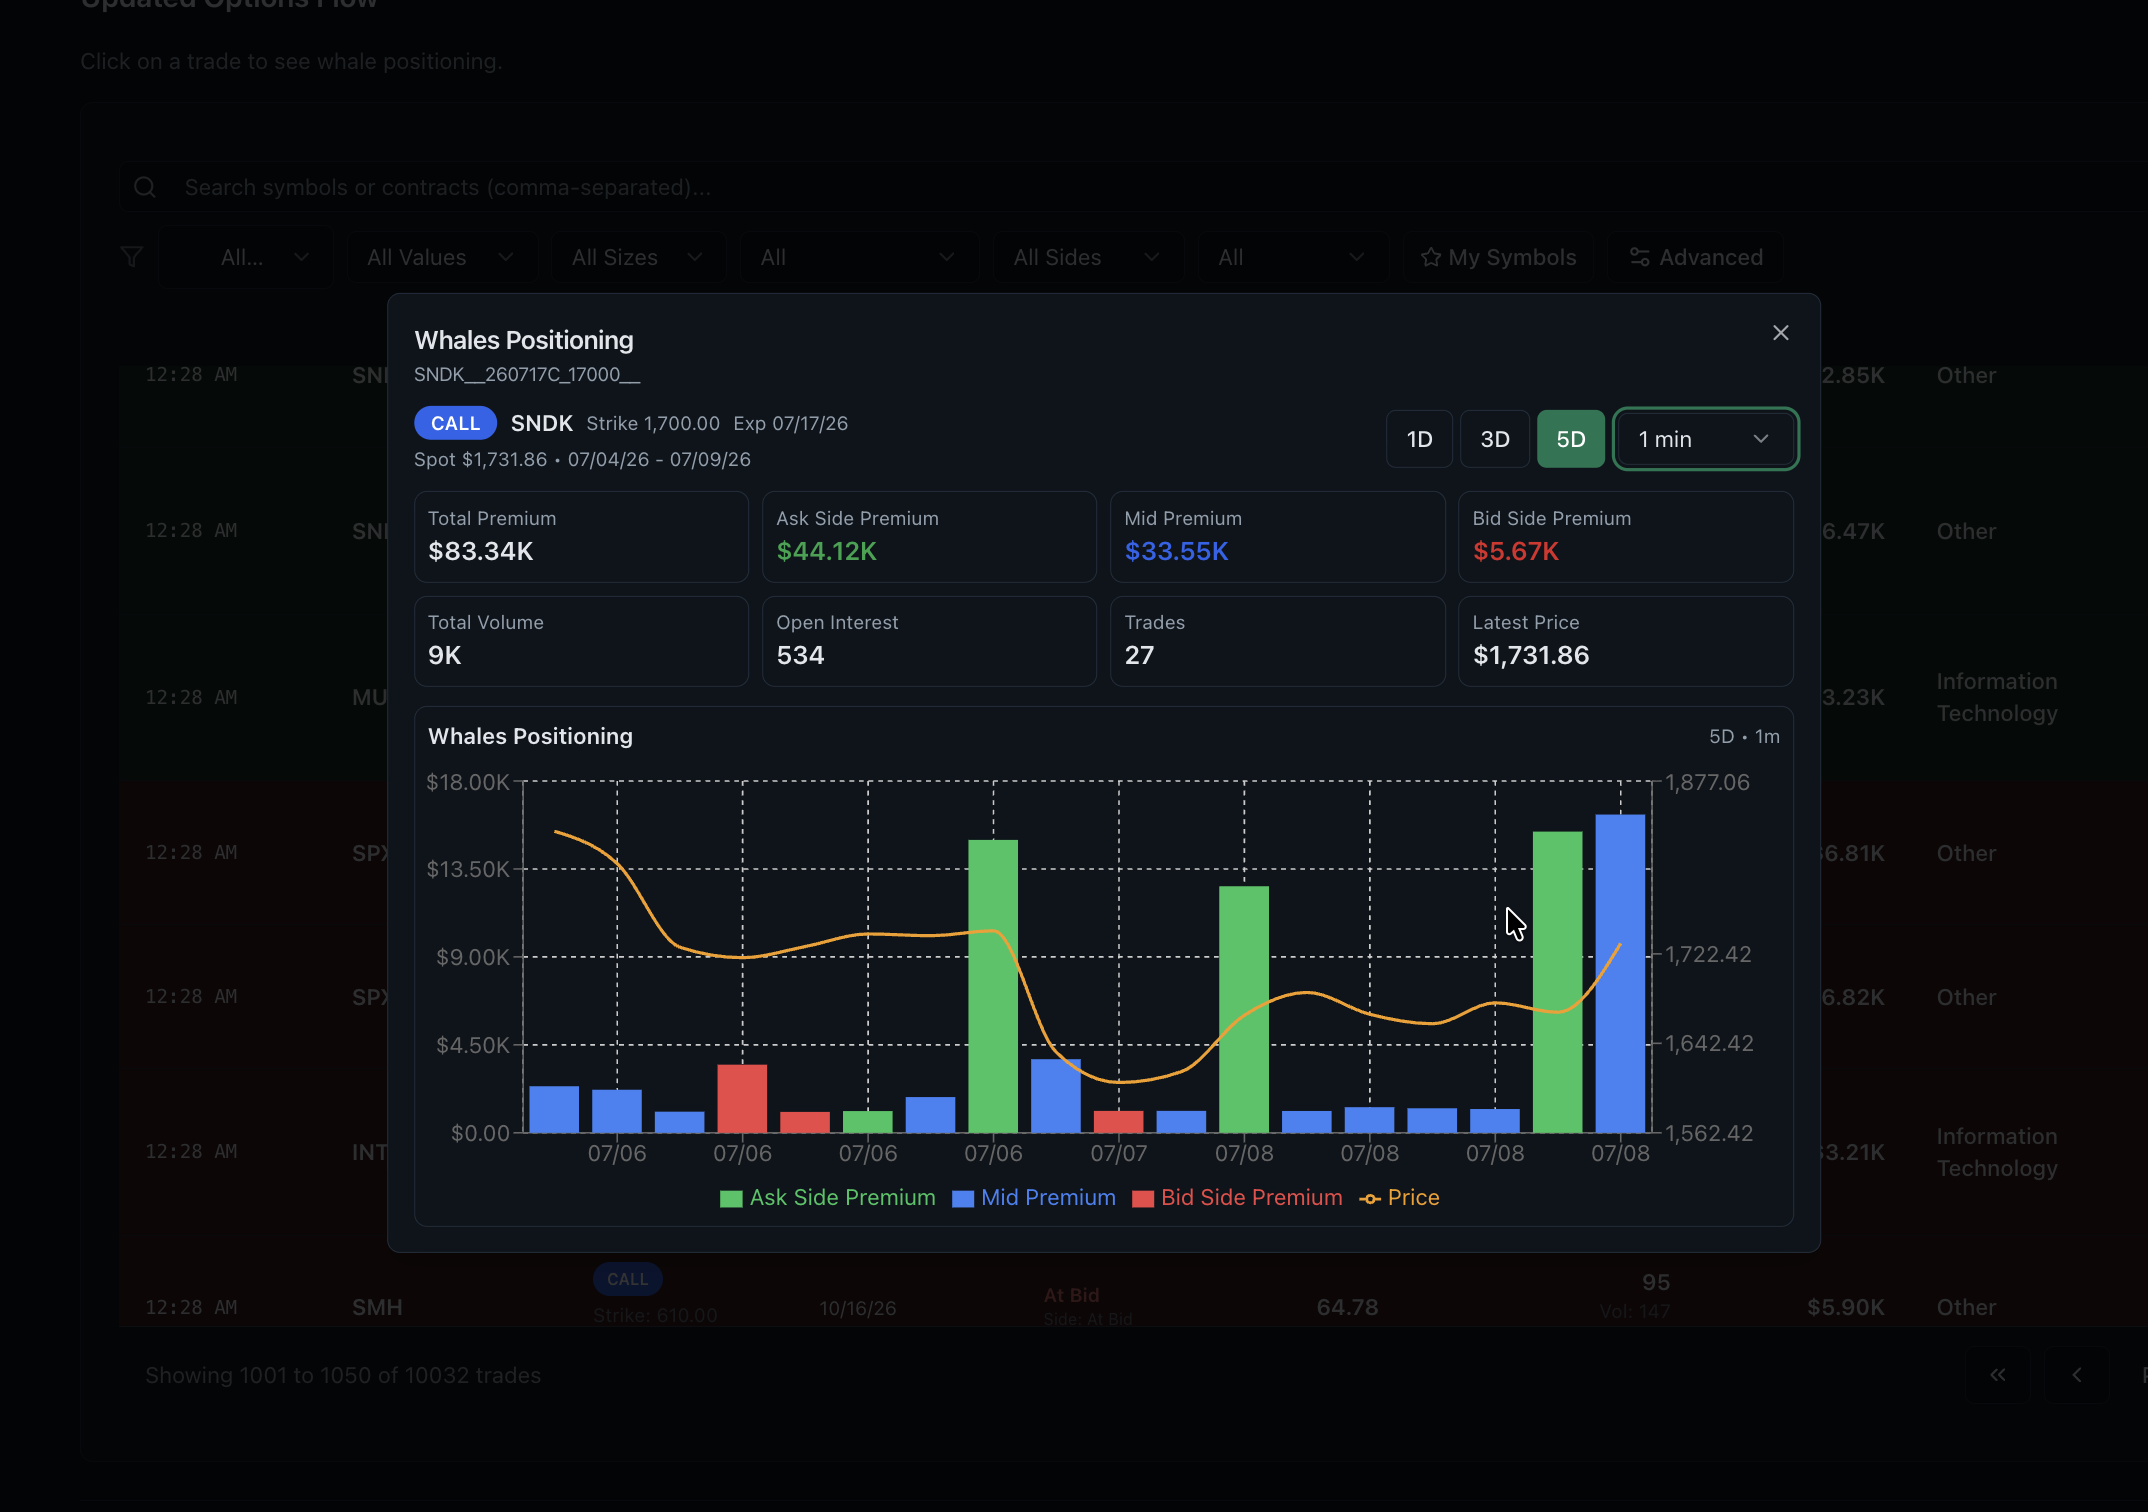
Real time options quotes show the current bid and ask for an option contract. Realtime Options adds historical quote-location context: printed premium classified near the ask, midpoint or bid, shown beside price, volume, open interest and trade count. It is a contract-history research view with the classification limits stated beside the data.
- What this is
- Quote context over time, per contract
- Product format
- Contract history rather than a current quote ladder
- Current quotes
- Commonly included with funded market-data accounts
- Why it matters
- Execution-location context helps compare printed activity
Why quote context adds more than a snapshot
A quote screen tells you the current bid and ask. A research view can also show where completed prints were classified relative to the spread and how those classifications changed through the session.
Read the supporting context
Ask-side, midpoint and bid-side are execution-location estimates. They help describe the tape, but they do not prove whether a position was opened, closed, hedged or paired with another leg.
Where real time options quotes usually come from
A funded US broker account commonly includes real-time option-chain quotes. Separate research platforms are useful when they add history, aggregation or context rather than reproducing the same bid-and-ask ladder.
- Broker platforms: current chains and quotes under the account's market-data entitlements.
- CBOE delayed quotes: free, 15 minutes behind, adequate for end-of-day work.
- OPRA direct: real-time, exchange-entitled, several hundred dollars a month plus engineering.
What quote context looks like here
Open any contract and you get a time series rather than a snapshot. Premium is split three ways at every point in the session, with volume, open interest and trade count on the same axis so a spike in premium can be checked against whether it was one block or four hundred retail lots.
- Premium at the ask, mid and bid, each plotted separately across the session.
- Contract price alongside premium, so a rising premium on a falling price is obvious.
- Volume and trade count together, which distinguishes one 5,000-lot block from 5,000 one-lots.
- Open interest, to tell an opening position from a closing one.
Common questions
What does the contract quote view include?
It includes ask-, mid- and bid-side premium history beside contract price, volume, open interest and trade count for independent research.
Are the quotes real-time or delayed?
Quote context is near-real-time on the $29 Pro plan and 15-minute delayed during the 3-day trial. It is derived from licensed third-party market data rather than a direct exchange feed.
Why does premium at the mid matter?
Mid-priced premium usually means a negotiated or spread trade rather than someone lifting an offer. Large mid prints often belong to multi-leg structures, so reading them as directional conviction is a common mistake.