


Open interest
Open interest is the number of contracts still outstanding at a strike and expiry after clearing. The OCC publishes it once per day after the close, so intraday you are always reading yesterday's figure, from any provider, regardless of what is advertised. That single fact governs how it can honestly be used.
- Pages on this topic
- 13
- Where to start
- Read volume versus open interest first, then the open-interest dashboard guides, then the premium-versus-open-interest view that puts new activity on top of existing positioning.
- Applies to
- US-listed stock and ETF options
- Purpose
- Independent research and education
Volume and open interest answer different questions
Volume counts what traded today. Open interest counts what is still held. Volume above existing open interest at a strike suggests new positioning; volume well below it is more consistent with trading around an existing position. Neither is automatically bullish or bearish, because the direction depends on who opened what.
Read the supporting context
The useful comparison is the day-over-day change in open interest against yesterday's volume, which is the closest public evidence of whether activity opened or closed positions. It arrives a day late, and that is the constraint.
Concept guides
- Call options explainedA call option gives its buyer the right, not the obligation, to buy 100 shares of the underlying at a fixed strike price on or before expiration, in exchange for a premium paid to the seller.
- Covered call screener: what it screens and how to read itA covered call screener ranks call options you could sell against shares you already own, usually by premium received, return if the stock is unchanged, return if the shares are called away, an annualised equivalent of those returns, and the downside buffer the premium provides.
- Cash-secured put screener: collateral, yield and assignmentA cash-secured put screener ranks put options you could sell while holding the full strike value in cash, usually by premium, return on that collateral, an annualised equivalent and the effective purchase price if you are assigned.
- Options volume versus open interestOptions volume is the number of contracts traded during the current session, while open interest is the number of outstanding contracts that remain open after clearing.
Screens, tools and comparisons
- Call wall and put wall explainedA call wall is the strike above the current price holding the most call open interest.
- Options volume scanner: reading a volume spike correctlyAn options volume scanner ranks contracts and tickers by how much trading occurred, usually against their own recent average, so unusually active strikes surface without reading the chain by hand.
Dashboard guides
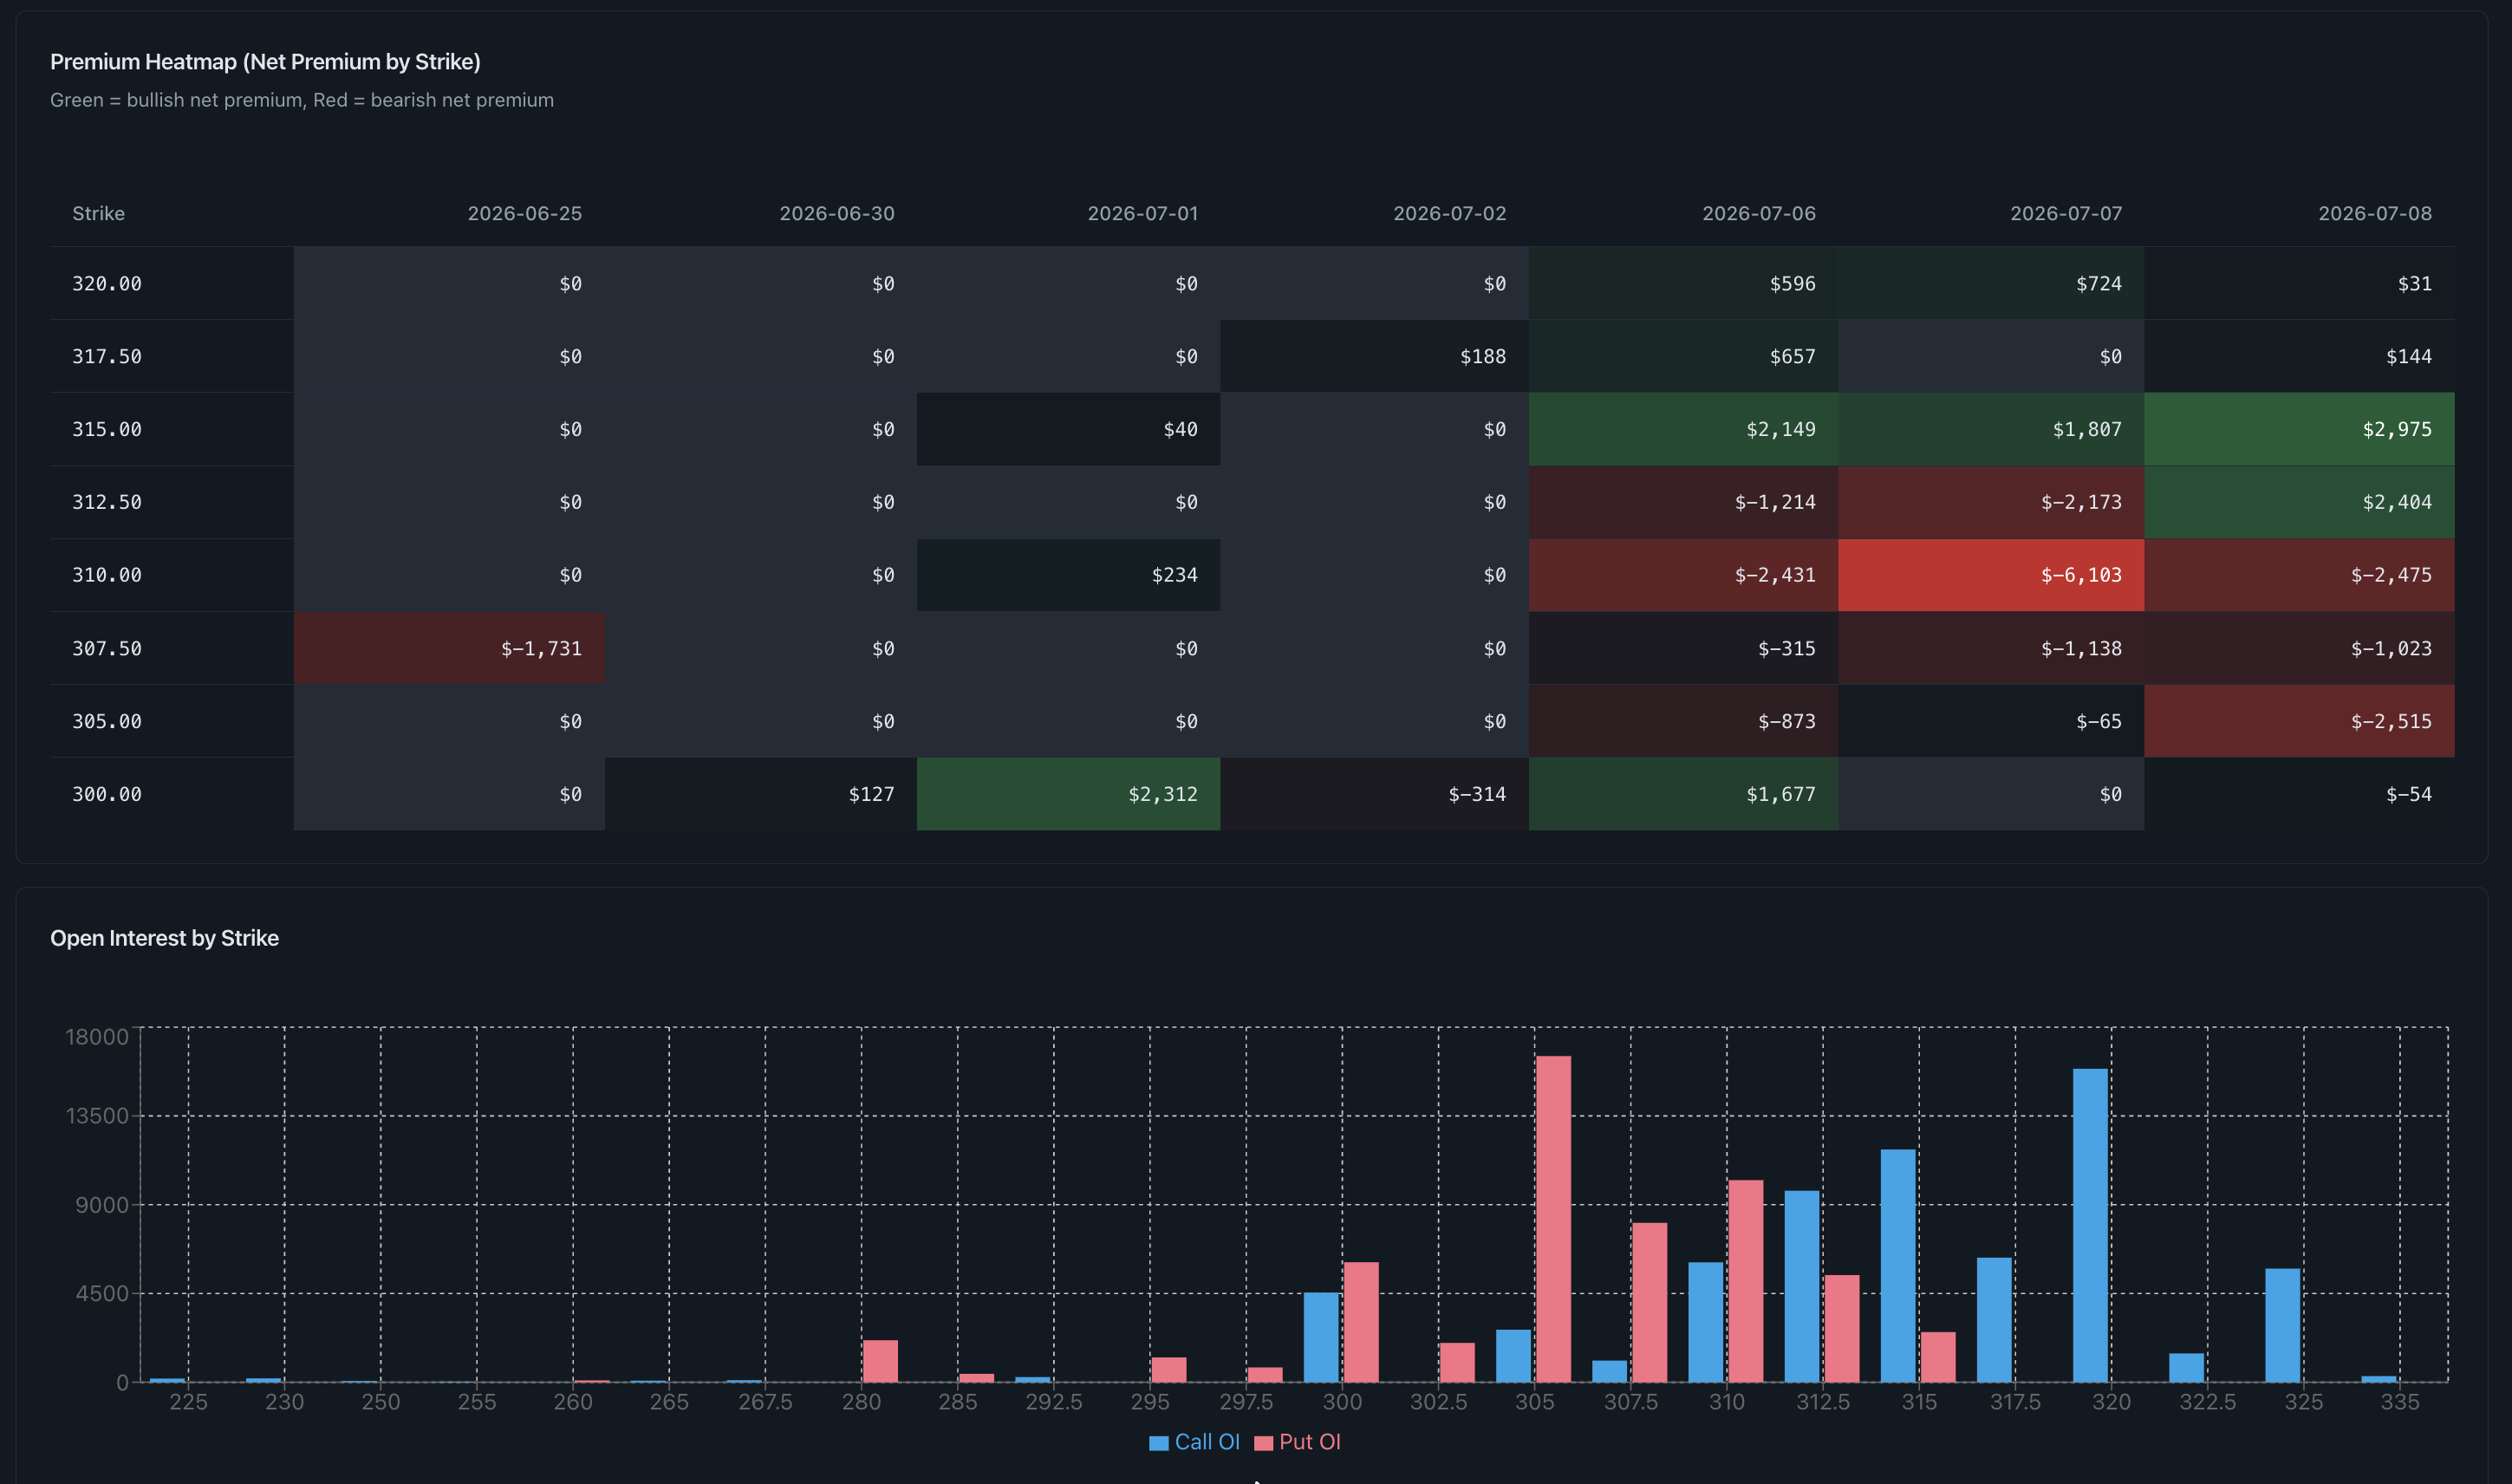
- Premium by strike with open interestThis view stacks intraday net options premium by strike above call and put open interest at the same strikes.
- Open Interest Heatmap ToolThe Realtime Options Open Interest Heatmap is an interactive strike-by-expiry grid for inspecting where one symbol's outstanding contracts are concentrated.
- Open Interest LensOpen Interest Lens maps the latest cleared call and put open-interest snapshot by strike and overlays runtime quote-side execution evidence for a selected expiry and contract.
Applied workflows and method posts
- Swing trading options: a multi-session flow routineA swing options research routine reads positioning that accumulates across sessions rather than reacting to a single print.
- How to read a week of SPY options flowReading a week of SPY options flow means separating the fields that reset every session from the ones that accumulate across the week.
- Why options volume alone misleadsA contract volume number is a sum, and sums destroy the structure that made them interesting.
- How to read an open interest heatmap beside options flowAn open interest heatmap shows where outstanding call and put contracts sit across strikes using the latest cleared daily figures.
Common questions
Can I get intraday open interest anywhere?
No. Open interest is a clearing figure produced by the OCC after the session settles. Any product showing an intraday open-interest number is showing an estimate or the prior day's official value.
Does rising open interest mean the position is bullish?
It means contracts were opened, not which side opened them or why. Rising call open interest is equally consistent with call buying and with covered-call writing against stock.