


Swing trading options: a multi-session flow routine
A swing options research routine reads positioning that accumulates across sessions rather than reacting to a single print. It combines the Flow Trend Dashboard for multi-day direction, the daily open-interest change published after each close, the Swing Contract Compass for a structured evidence review, and Historical Flow Analysis to test whether the pattern is persistent or isolated. The routine produces a documented observation with explicit invalidation conditions, not a trade plan.
- Horizon
- Several sessions to several weeks
- Primary screens
- Flow Trend, Open Interest Lens, Swing Contract Compass, Historical Flow
- Confirmation step
- Open-interest change, published once daily after the close
- Valid outcome
- No clear edge, when the evidence disagrees
- Keep in mind
- Open interest reveals size, never side or intent
- Data timing
- A 15-minute delay barely affects a multi-session review
What a multi-session routine is actually looking for
A swing routine is looking for repetition, not size. One large print tells you a transaction occurred; the same strike and expiry attracting activity across four sessions while open interest rises tells you that positioning is being built and held. The second pattern is harder to fake and far easier to review calmly after the close.
Read the supporting context
This shifts the unit of analysis. In an intraday routine the unit is a print. In a swing routine the unit is a contract observed across a window, with the question being whether it keeps appearing when nothing dramatic is happening.
- Persistence: does the same strike and expiry keep appearing across sessions?
- Direction of open interest: is the outstanding position growing, flat or shrinking?
- Price agreement: does the underlying's multi-session structure agree with the classified flow?
- Breadth: is the activity isolated to one contract or spread across an expiry ladder?
- Silence: are the sessions with no activity being counted, or only the exciting ones?
Day one: establish the trend backdrop before the flow
Start with the Flow Trend Dashboard, which compares several flow measures across recent sessions rather than showing one day in isolation. The question at this stage is narrow: is the current session unusual relative to the recent window, or does it only feel unusual because you are watching it live?
Read the supporting context
Then open Underlying Pulse for the names that survive, to check whether intraday price structure agrees with the classified options activity. Disagreement is useful information and should be written down rather than resolved by preferring whichever screen supports the more interesting story.
- Flow Trend Dashboard: place today inside the recent multi-session range for each flow measure.
- Sector and Ticker Flow: confirm the activity has company in its sector or note that it does not.
- Underlying Pulse: compare intraday price structure with the options activity for the shortlisted names.
- Record the shortlist. Two to four names is a routine; twenty is a feed.
Open interest is the confirmation step, and it arrives the next morning
Open interest is the count of contracts still outstanding after clearing, published once daily after the close by OCC. It is never available intraday, from Realtime Options or from any other vendor, and any product implying live open interest is describing something else. For a swing routine this is a feature rather than a limitation: the confirmation arrives with the session already finished and the noise already settled.
Read the supporting context
The Open Interest Lens compares cleared positioning with current-session execution, which is the specific comparison that distinguishes new positioning from churn. Volume alone cannot make that distinction, because a contract that opens and closes inside the same session adds to volume and leaves open interest unchanged.
| Volume and open-interest combination | What it can and cannot support |
|---|---|
| Heavy volume, open interest rises the next morning | Consistent with new positioning being built; still silent on which side opened it |
| Heavy volume, open interest roughly unchanged | Consistent with opening and closing inside the session, or with day-trading activity |
| Heavy volume, open interest falls | Consistent with positions being closed, rolled or assigned; not automatically the opposite view |
| Light volume, large existing open interest | Older positioning of unknown age that may already be hedged, rolled or ignored |
The structured review: Swing Contract Compass
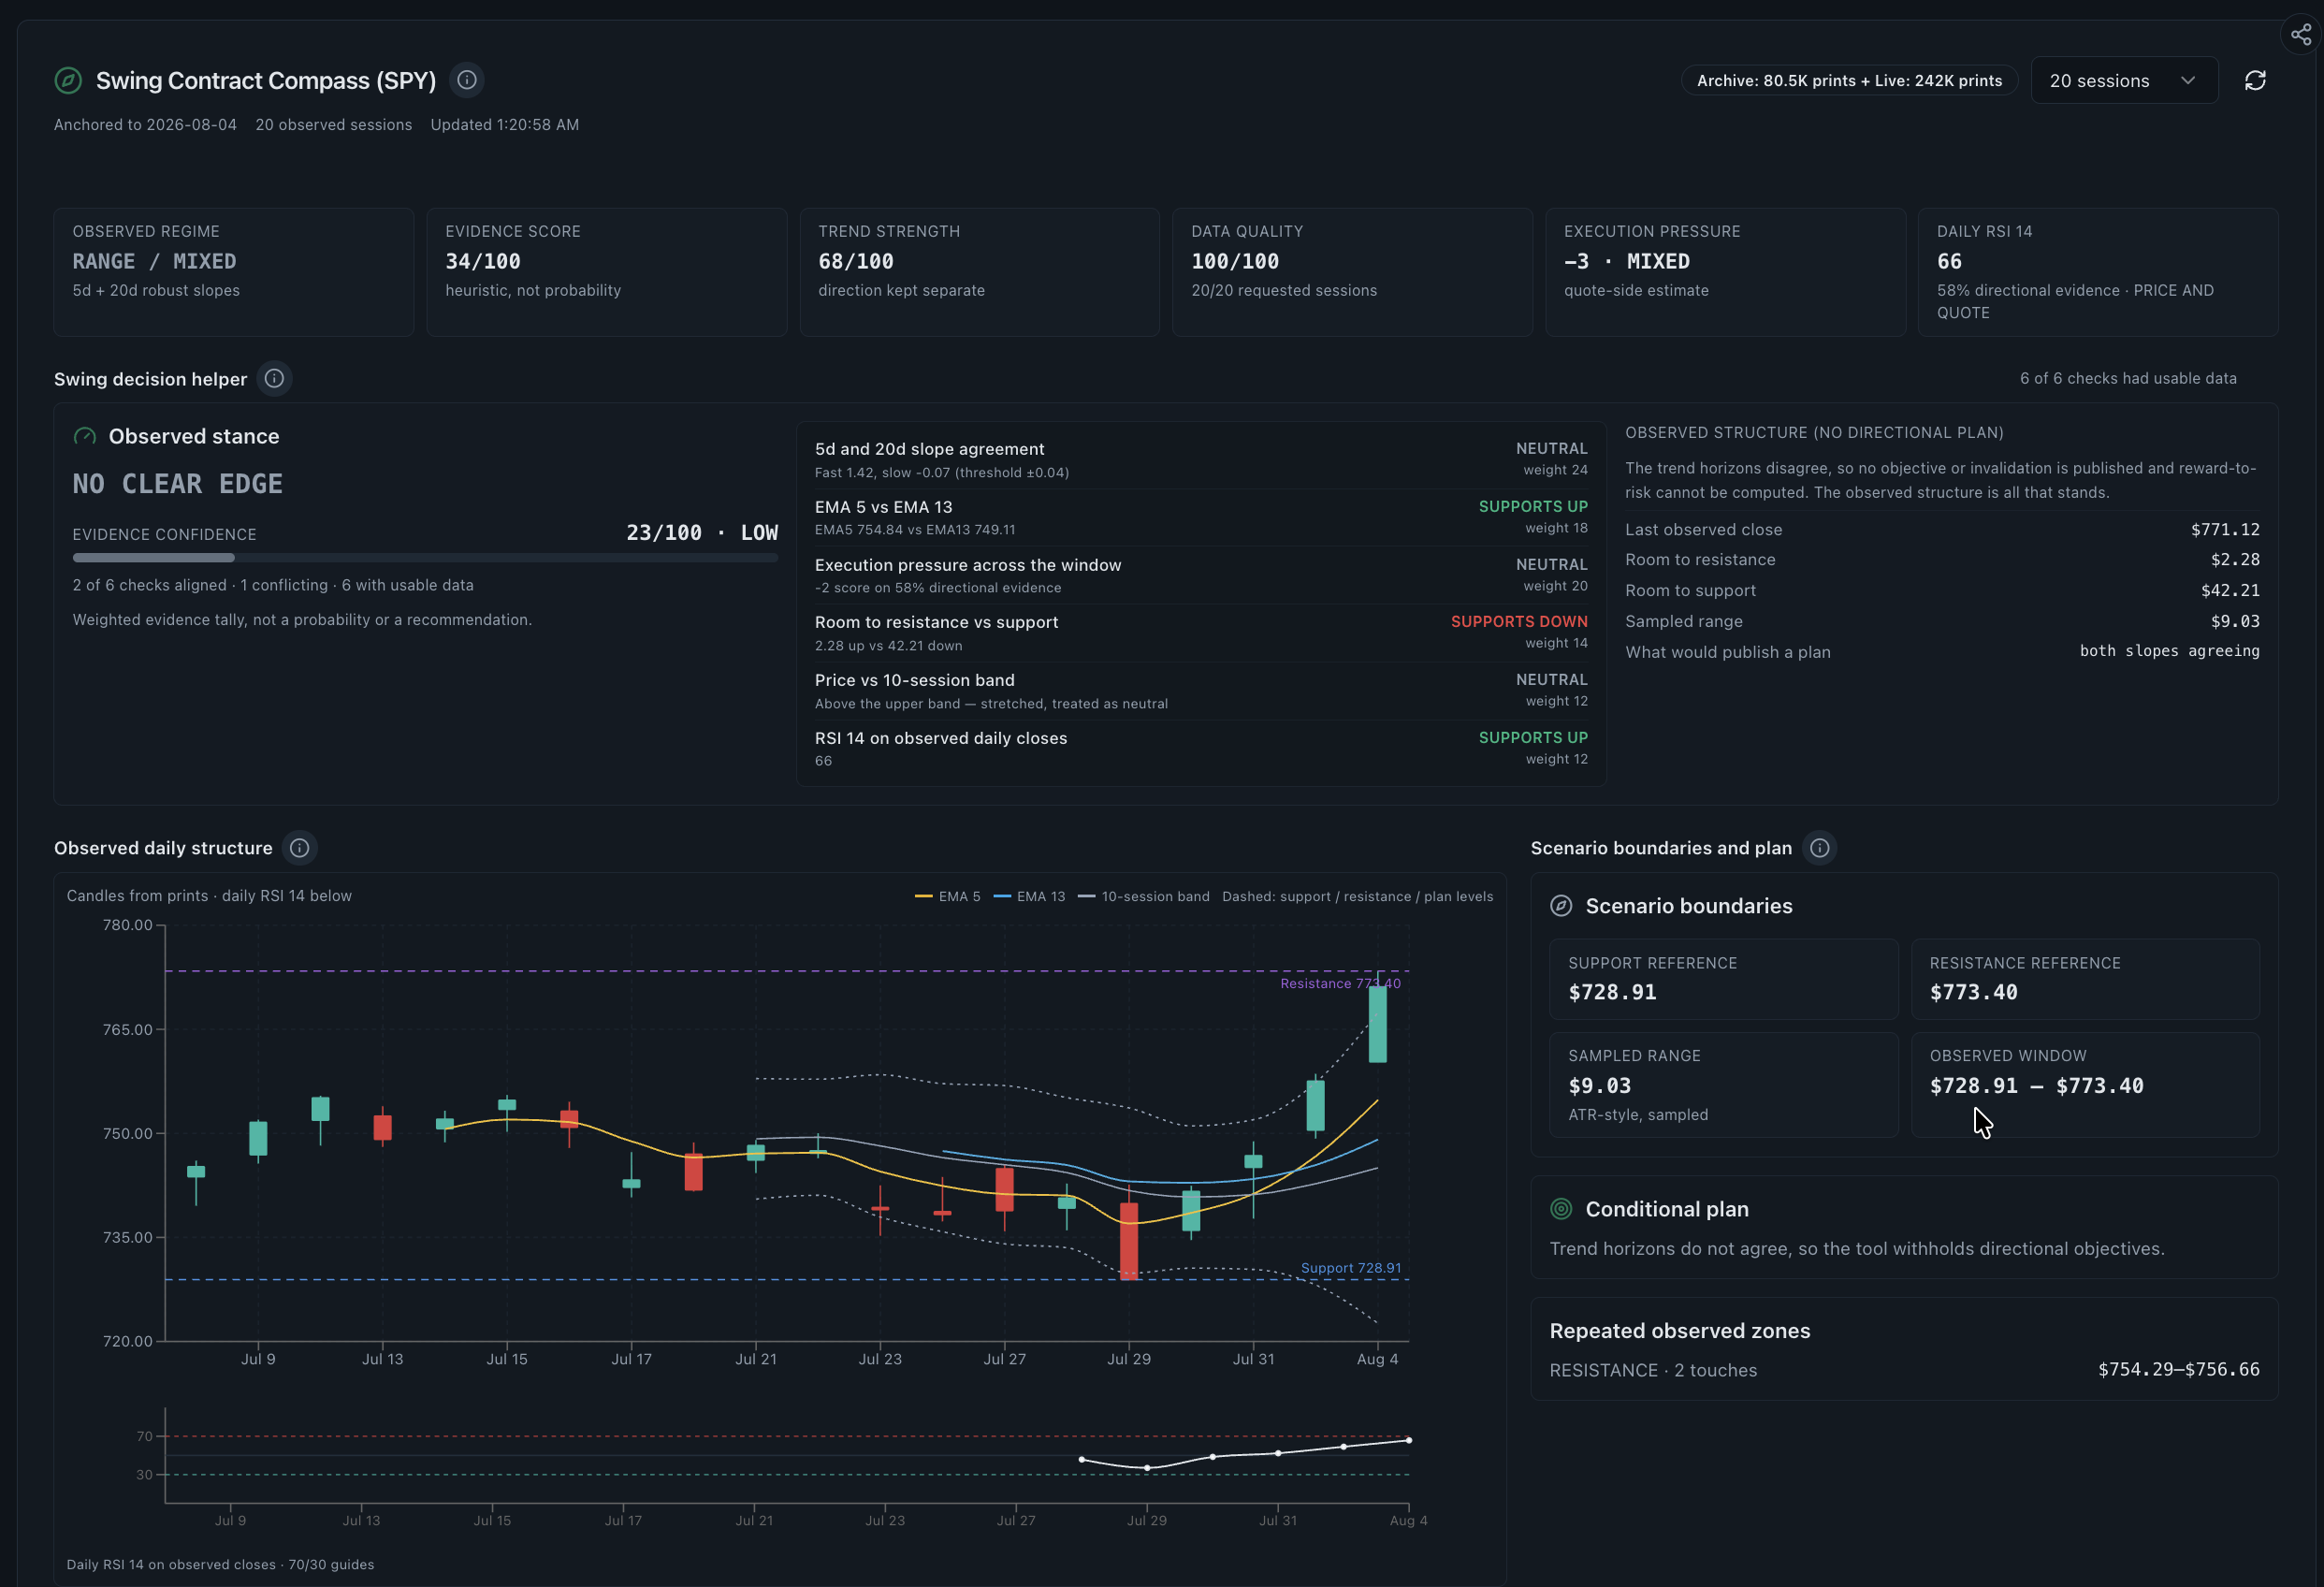
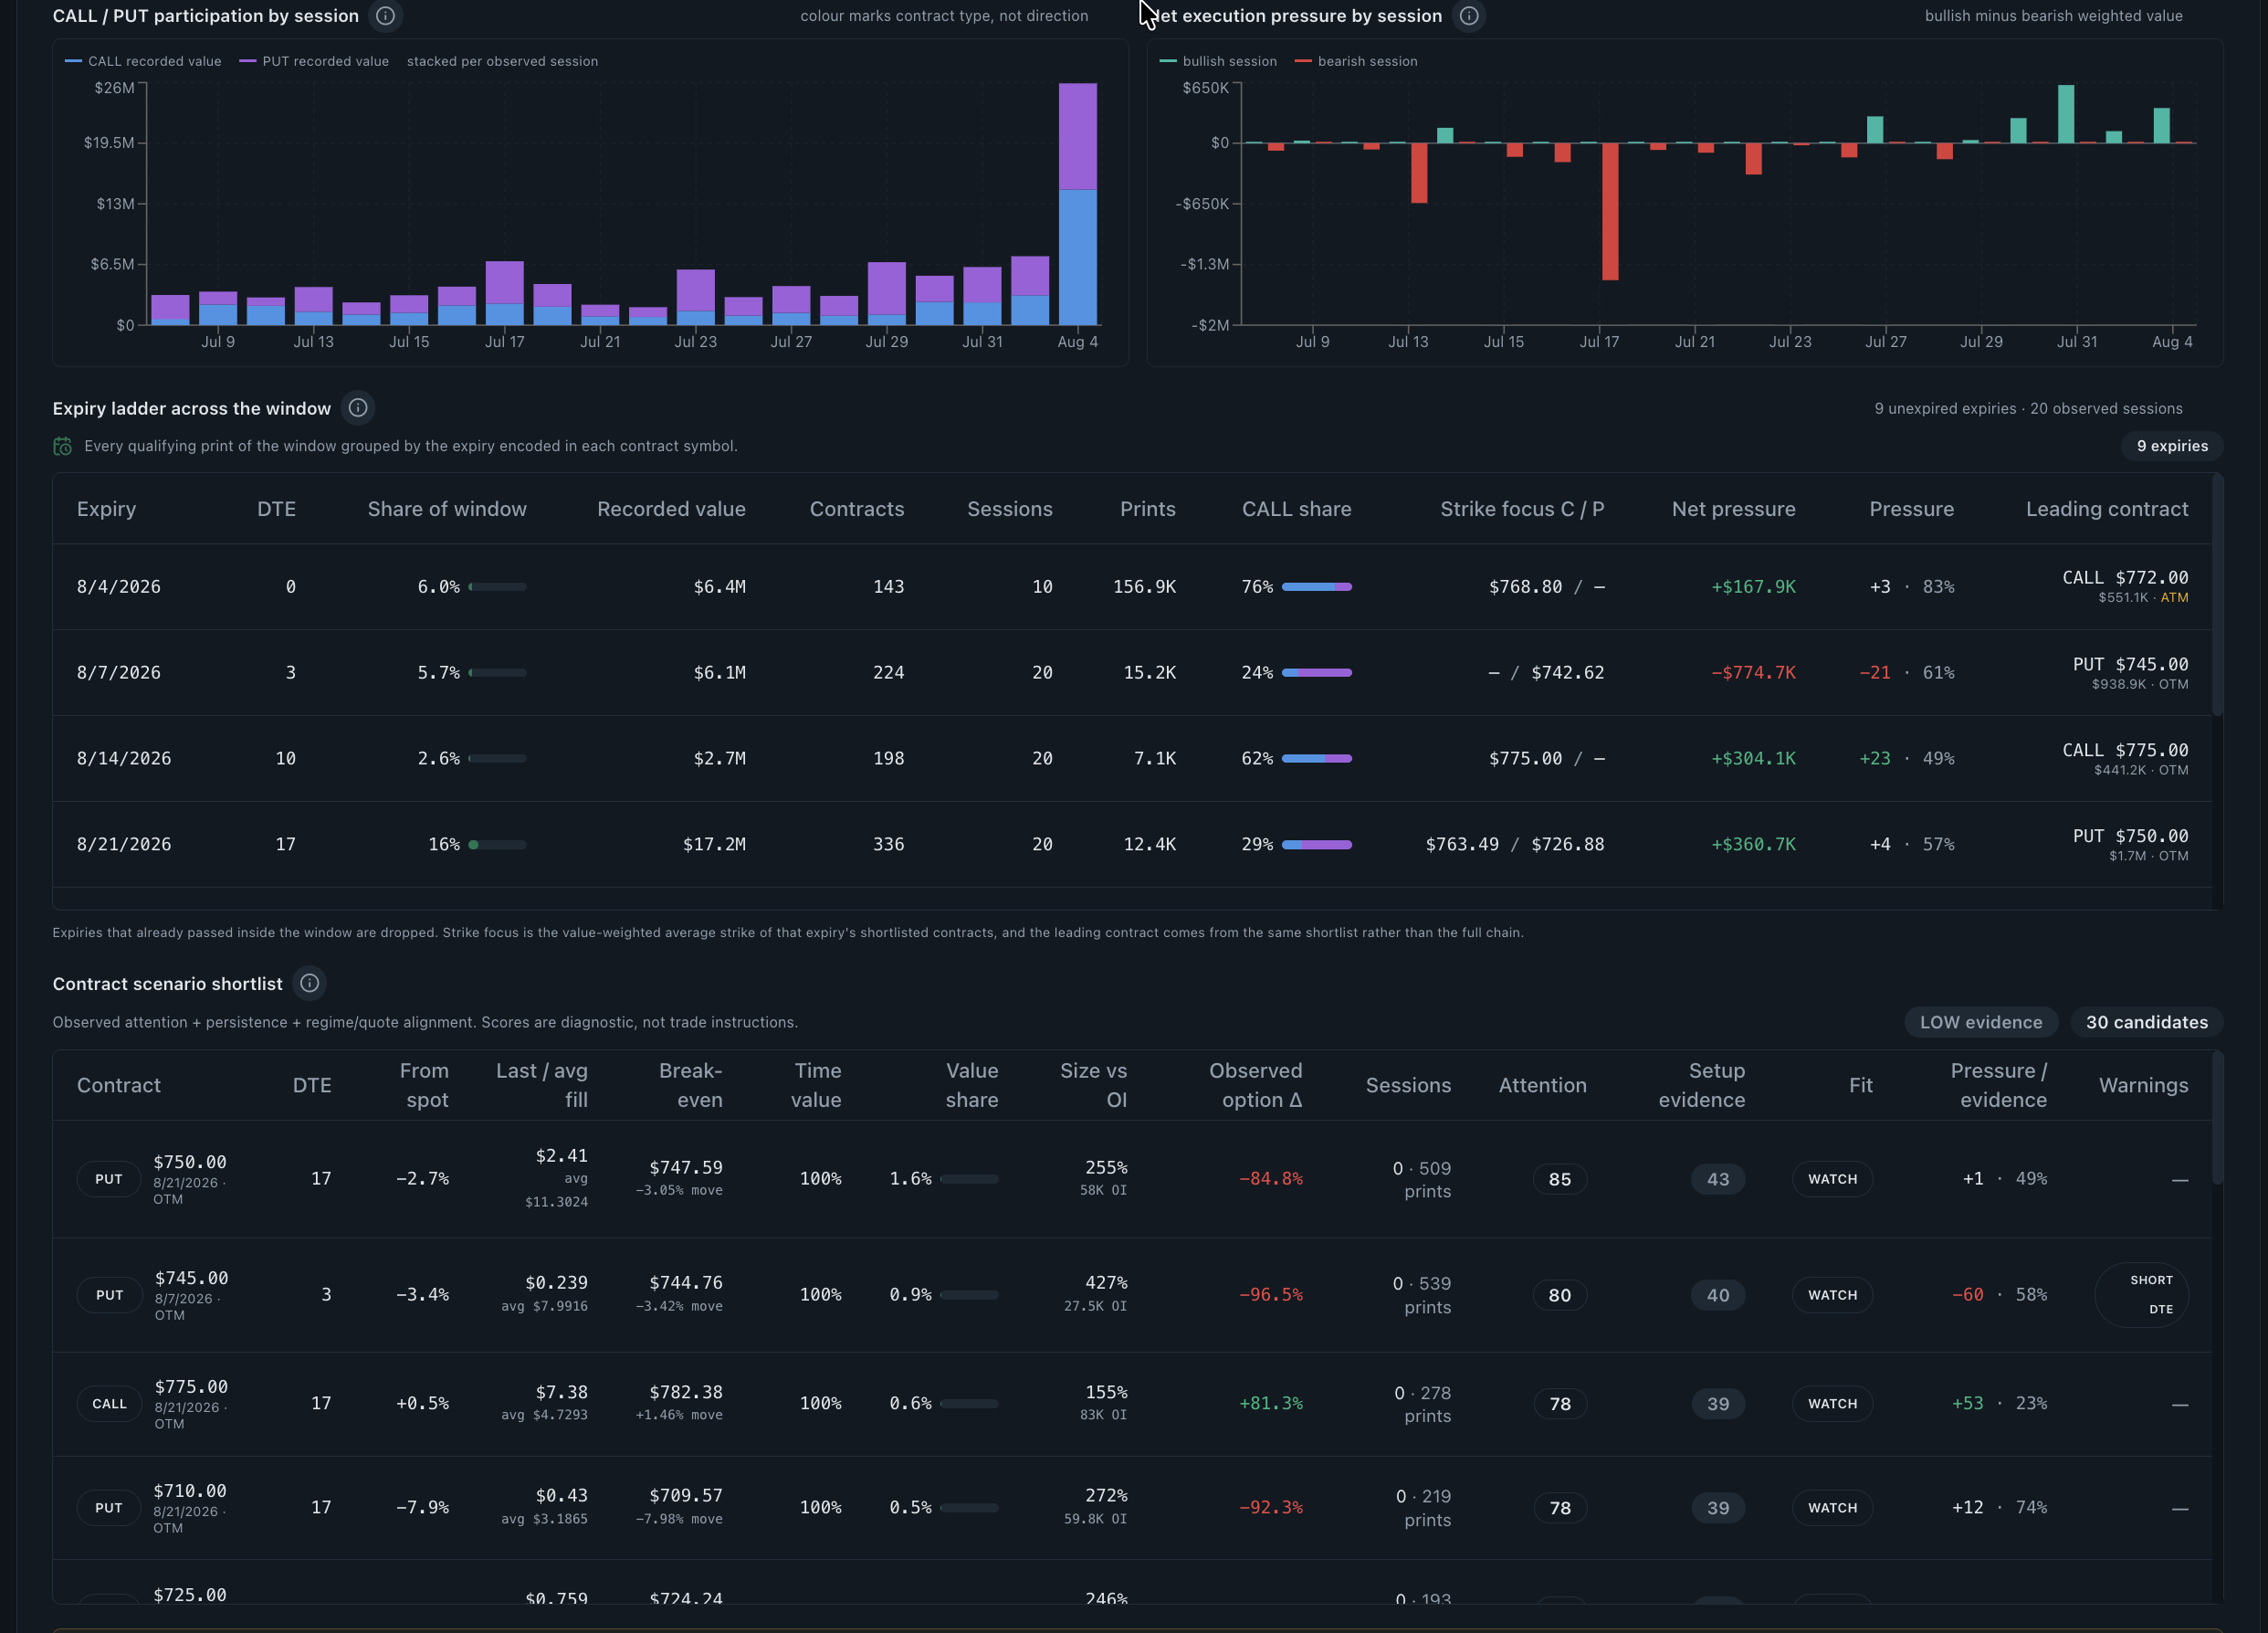
Swing Contract Compass places multi-session price structure, moving-average slopes, RSI, execution pressure, expiry participation and a contract shortlist on a shared lookback window. Its most useful behaviour is that it withholds a directional scenario when its checks disagree, which is a more accurate output than manufacturing one.
Read the supporting context
Read it in order rather than skipping to the shortlist. Data quality and session coverage come first because a score computed on an incomplete window is a different measurement, not a weaker signal. Fast and slow trend horizons come next, and they should be allowed to disagree.
- Confirm the requested sessions have usable data before reading any score.
- Read fast and slow trend horizons separately and note where they conflict.
- Compare price structure against execution pressure over the same window.
- Inspect expiry participation before narrowing to any individual contract.
- Accept a no-clear-edge result as a completed review rather than a failed one.
Historical Flow Analysis: pattern or coincidence
Before recording an observation, check whether the current activity resembles anything in the ticker's own history. Historical Flow Analysis is there to answer whether today is part of a broader pattern or an isolated event that happens to be visible because you are looking at it.
Read the supporting context
The honest use of history is calibration, not extrapolation. Knowing that similar activity has appeared in this name several times in recent months tells you the current reading is not rare; it does not tell you what followed those episodes, and the platform makes no claim about repeatability. There is no backtesting engine and no published hit rate, deliberately.
- Compare the current window against the same ticker's earlier flow, not against a market-wide average.
- Note how often similar activity has appeared: frequency changes how much weight a reading deserves.
- Check whether earlier episodes clustered around known catalysts such as earnings or index events.
- Do not infer outcome. Historical similarity is context, never a forecast.
Invalidation before conviction
A swing observation is only complete once you have written the condition that would make it wrong. In a multi-session routine those conditions are unusually easy to specify, because the evidence is measured in sessions and can therefore be checked on a schedule rather than in the moment.
Read the supporting context
This also fixes the most common failure in swing options research, which is holding a view long after the evidence that produced it disappeared. If the contract stops appearing and open interest starts falling, the observation has expired whether or not price has moved.
- The contract stops appearing in daily activity for a defined number of sessions.
- Open interest at the strike declines rather than continuing to build.
- Price structure breaks the multi-session reference the observation was built around.
- Sector or index flow turns against the single-name read, leaving it isolated.
- A catalyst arrives that explains the entire earlier build, removing the reason it looked notable.
What multi-session flow cannot establish
Persistence across sessions is stronger evidence than a single print, but it is still evidence about transactions rather than positions. Rising open interest tells you contracts are outstanding; it does not tell you who is long, who is short, or whether the position is hedged elsewhere in a portfolio.
Read the supporting context
The Compass shortlist, the scores and the support and resistance references are heuristic diagnostics computed from observed data. They are not objectives, entries, exits or position sizes, and they do not account for your circumstances or risk tolerance.
- It cannot identify the owner of any position or the reason it exists.
- It cannot separate a directional position from a hedge against stock, futures or another option.
- It cannot tell you whether the buyer or the seller of the outstanding contracts is the informed side.
- It cannot produce a backtest, a win rate or an expected return; none of those exist in the product.
- It cannot screen for premium yield, IV rank or IV percentile, which are not part of the platform.
Common questions
How is swing options research different from intraday flow reading?
The unit of analysis changes. Intraday work examines prints within a session; swing work examines whether the same strike and expiry keep attracting activity across sessions while open interest builds. The second is slower and easier to review after the close.
How often does open interest update?
Once daily, after the close, from OCC. It is not available intraday from Realtime Options or any other vendor. For a multi-session routine that timing is workable, because the confirmation arrives with the session already complete.
Does rising open interest mean the position is bullish?
No. Open interest counts outstanding contracts and reveals nothing about which side opened them. Rising open interest at a call strike is equally consistent with buyers opening long calls and with sellers writing calls against stock.
Why does Swing Contract Compass sometimes show no clear edge?
Because its checks are allowed to disagree. When fast and slow trend horizons, execution pressure and price structure conflict, reporting the conflict is more accurate than averaging it into a directional scenario that the evidence does not support.
Can I backtest a swing pattern in the platform?
No. Realtime Options has no backtesting engine and publishes no win rates, hit rates or performance results. Historical Flow Analysis shows how often similar activity has appeared, which is calibration rather than a claim about what followed.
Is the 15-minute trial delay a problem for swing research?
Barely. Evidence measured in sessions is unaffected by a 15-minute shift, so the 3-day trial can genuinely test this routine. The delay matters far more for intraday and same-day expiry work.
Can this routine find covered call or cash-secured put candidates?
No. Realtime Options does not screen contracts by premium yield, annualised return, IV rank or IV percentile. It documents observed flow, cleared open interest and modeled exposure, which is a different question from income screening.