


Earnings options flow: reading positioning before the print
Pre-earnings options flow shows that market participants are positioning around a scheduled event; it does not show that anyone knows the result. The routine reads how activity builds into the print, compares the priced movement against the ticker's own history, and then treats the post-print session as a separate measurement. The single most important mechanic is that implied volatility collapses once the result is public, which is why an option buyer can be directionally right and still lose money.
- Window
- Roughly five sessions before the print through the session after
- Primary screens
- Premium Edge, Flow Trend, Premium Heat Grid, Market News
- Key mechanic
- Implied volatility falls sharply once the result is public
- Common misreading
- Treating pre-event positioning as private knowledge
- Keep in mind
- Hedging and directional bets look identical in volume data
- Confirmation lag
- Open interest publishes once daily, so the event day settles the next morning
What pre-earnings flow shows, and what it does not
Pre-earnings options flow shows that contracts expiring around a scheduled event are attracting activity and premium. That is a statement about attention and positioning. It is not a statement about information, and the distinction matters more here than almost anywhere else in flow research.
Read the supporting context
Earnings are the most predictable uncertainty in the calendar. Everyone knows the date, everyone knows a move is likely, and a great deal of the resulting volume is protective rather than speculative. Institutions holding stock buy puts to limit downside; funds write calls against long positions; market makers hedge inventory. All of that prints into the same tape as a directional bet and looks identical in a volume column.
- Observed: which strikes and expiries around the event are attracting contracts and premium.
- Observed: whether activity is building steadily or arrived in one session.
- Estimated: whether the aggressor was on the bid or the ask side of each print.
- Unknown: whether the position is a hedge, a spread leg, a roll or a directional view.
- Unknowable: the result of the print, by anyone reading public options data.
The routine into the print
Run the pre-event window as a build rather than a snapshot. A single heavy session three days before earnings tells you far less than a steady accumulation across five, and the difference is only visible if you look at the sessions rather than the day.
Read the supporting context
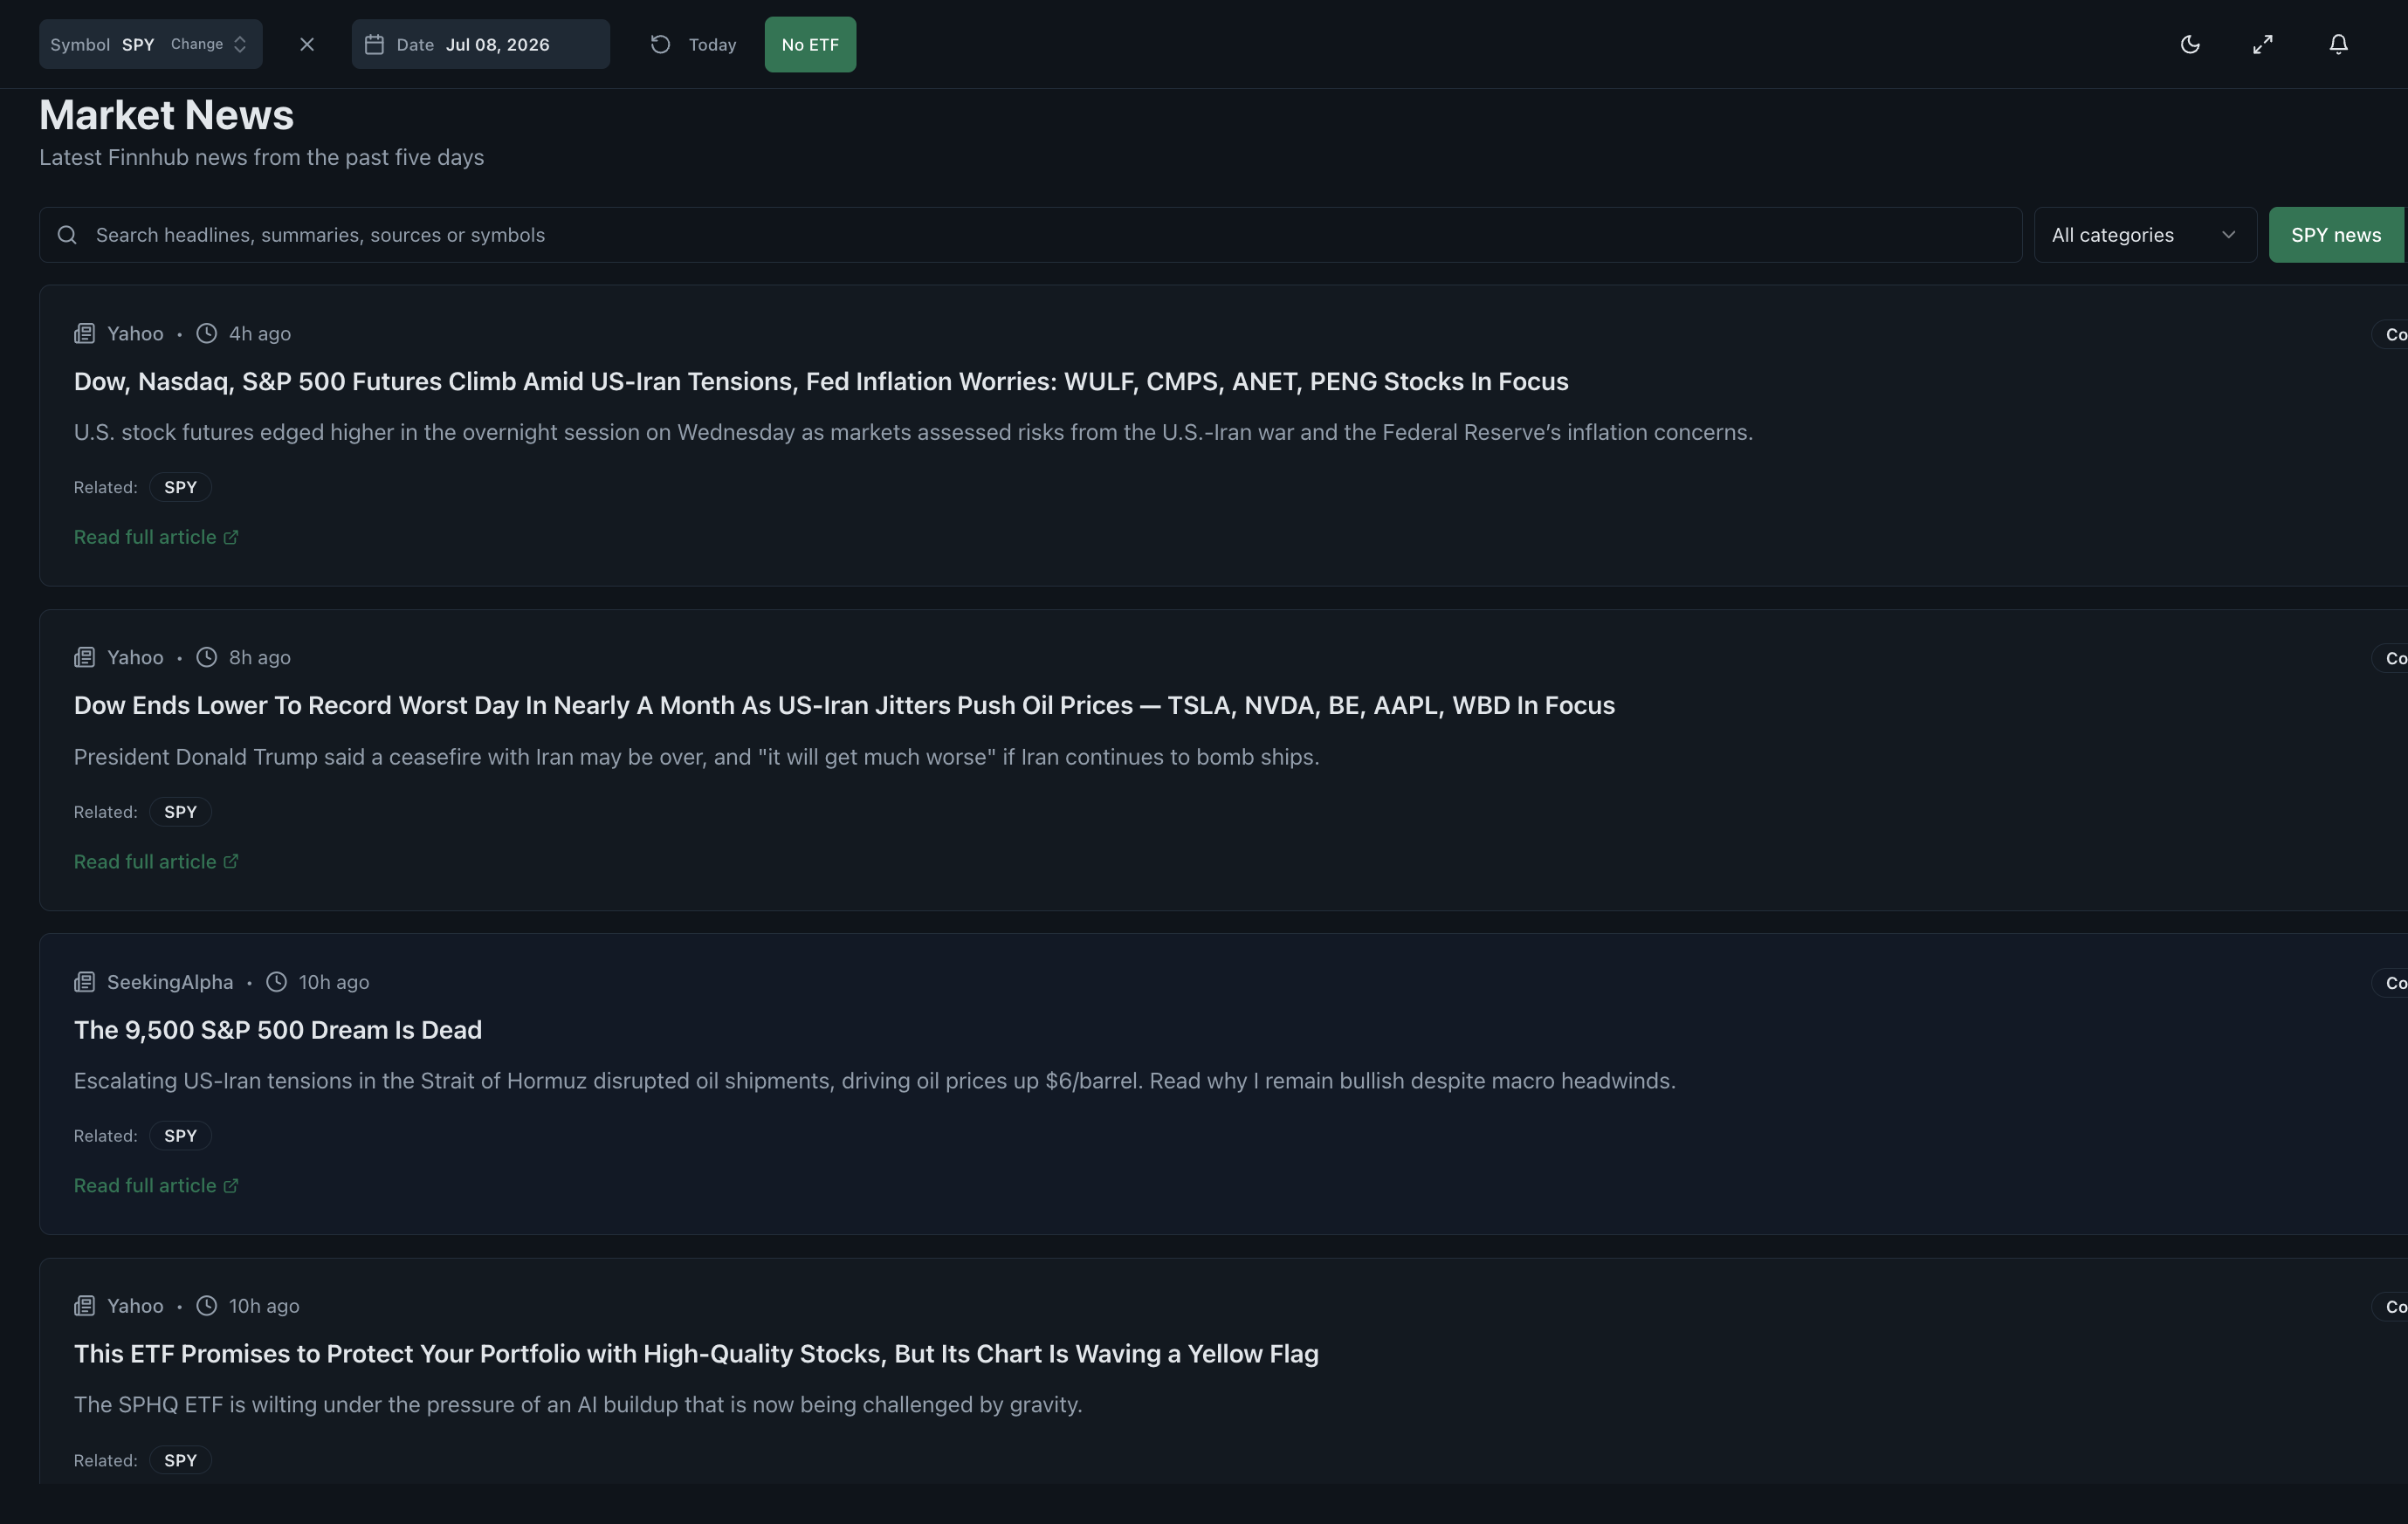
Keep the news screen open alongside the flow screen throughout. A large part of what looks like anticipatory positioning is explained by a public headline that arrived first, and finding that headline is the cheapest way to deflate a story before it hardens.
- Confirm the event date and timing from a primary source before reading anything into the activity.
- Use Flow Trend to place the current sessions inside the ticker's recent multi-session range.
- Use the Premium Heat Grid to see whether activity concentrates in the event expiry or spreads across the ladder.
- Check Market News for a timestamped headline that already explains the activity.
- Note the balance between the event expiry and later expiries: concentration in the event week reads differently from a broad build.
The implied move, and where it comes from
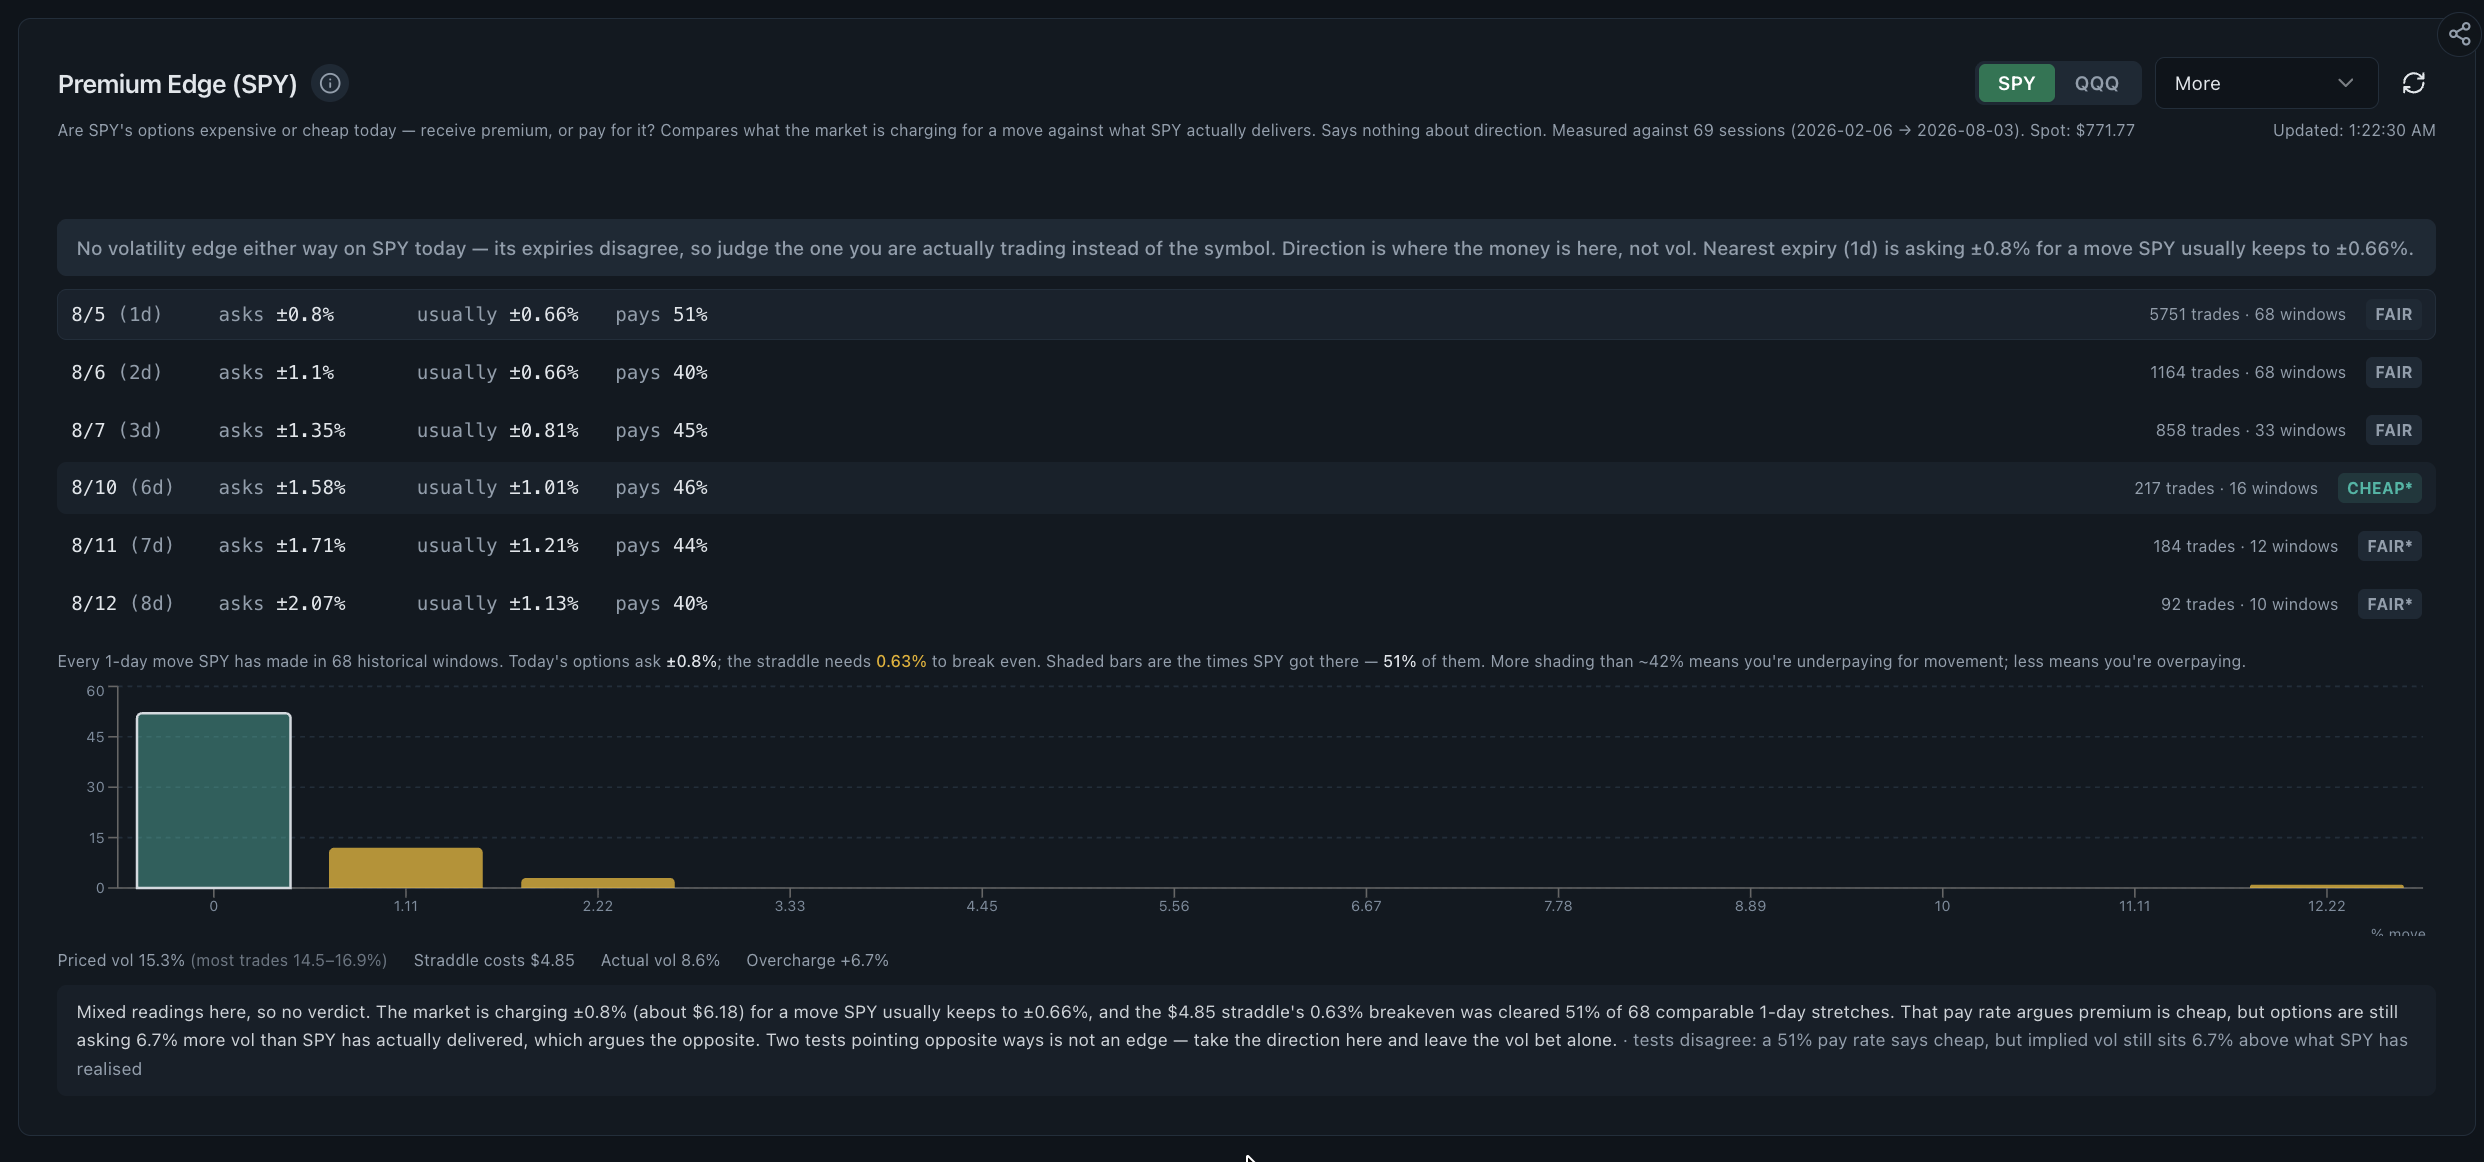
The implied move is derived from option prices, not from any analyst's opinion. When contracts expiring just after an event are priced with elevated volatility, the market is pricing a wider distribution of outcomes. Premium Edge compares that priced movement against a stated historical sample for the same ticker, which makes the comparison auditable rather than rhetorical.
Read the supporting context
The comparison tells you whether the event is priced richly or cheaply relative to the ticker's own history. It says nothing about direction. A rich implied move is a price, not a promise that the stock will move that far.
| Pre-event reading | What it can and cannot support |
|---|---|
| Priced movement well above the ticker's historical sample | Supports the observation that the event is expensively priced; says nothing about direction |
| Priced movement in line with history | Supports treating the event as ordinarily priced; does not make an outcome more likely |
| Heavy call premium into the print | Consistent with directional buying, covered-call writing or hedging a short position |
| Heavy put premium into the print | Consistent with downside protection on stock as easily as with a bearish speculative view |
Why the directionally right buyer so often loses
Before the print, options expiring just afterwards carry elevated implied volatility because the outcome is unknown. Once the result is public the uncertainty disappears, implied volatility falls sharply, and every option in that expiry loses the portion of its price that was compensation for the unknown. This is usually called volatility crush, and it is the normal mechanic rather than a market failure.
Read the supporting context
The consequence is arithmetic. If a contract is priced for a large move and the underlying delivers a smaller move in the correct direction, the value gained from the price change can be smaller than the value lost from the volatility collapse. The buyer was right about direction and still finished worse off. Any research routine that ignores this will consistently mis-explain what happened after the print.
- Volatility crush affects the whole expiry, not only the contracts that were wrong about direction.
- The closer the expiry sits to the event, the more of its price was uncertainty premium.
- A move smaller than the priced move can leave a directionally correct long option worth less than it cost.
- This is one reason post-event disappointment is common even when the headline result was as expected.
- None of this is a reason to take the opposite side: option sellers carry their own, often larger, risks.
The session after the print
Treat the post-event session as a separate measurement rather than as the verdict on the pre-event read. Volume after a print is dominated by closing, rolling and re-establishing positions, which means it is among the least clean directional evidence available even though it is often the largest volume of the month.
Read the supporting context
Open interest published the following morning is the more informative number. It shows whether the event-expiry positioning was actually closed out or whether contracts remain outstanding. As always it shows size, never side.
| Post-print observation | The more likely reading |
|---|---|
| Enormous volume in the event expiry | Positions being closed and rolled after the uncertainty resolved, not fresh conviction |
| Open interest in the event expiry collapses the next morning | Consistent with the event positioning being unwound as intended |
| Open interest builds in a later expiry | Consistent with attention moving to the next horizon; still silent on which side opened it |
| Price moves less than the priced move | Consistent with the event having been expensively priced; not evidence of a mispricing you can exploit |
What earnings flow cannot establish
No public options data reveals the result of an unreleased earnings report. Large pre-event positioning demonstrates that participants are taking positions around a known date, which is exactly what a functioning options market does before a scheduled catalyst.
Read the supporting context
The specific failure to avoid is running the interpretation backwards after the fact. Once the result is known it is trivial to find the pre-event flow that agreed with it and to describe it as foresight, while the equally large flow on the other side goes unmentioned. Recording the observation before the print is the only way to avoid this.
- It cannot reveal the earnings result, guidance or the market's reaction to either.
- It cannot distinguish protective hedging from directional speculation in volume data.
- It cannot identify who traded, or whether the position was closed minutes later.
- It cannot confirm intent from size: large positions are routine around scheduled events.
- It cannot support any claim of unusual knowledge, and this site makes none.
A pre-earnings reading checklist
The checklist exists to make the observation comparable across events. Written the same way each time, five earnings reviews become a dataset about your own reading rather than five separate impressions.
- Event date and timing, confirmed from a primary source.
- How the priced movement compares with the ticker's own historical sample.
- Whether pre-event activity built across sessions or arrived in one.
- Whether the concentration sits in the event expiry or spreads across later ones.
- The public headline, if any, that already explains the build.
- The observation recorded before the print, and the condition that would contradict it.
Common questions
Does heavy options activity before earnings mean somebody knows the result?
No. Earnings dates are public and a move is widely expected, so positioning around them is routine. Much of the volume is protective hedging on existing stock. Public options data cannot reveal an unreleased result, and this site makes no such claim.
What is volatility crush after earnings?
Before the print, options expiring just afterwards carry elevated implied volatility because the outcome is unknown. Once the result is public that uncertainty disappears and implied volatility falls sharply, reducing the price of options across that expiry regardless of direction.
Why did my option lose money when the stock moved the way I expected?
Most often because the move was smaller than the move that was already priced in, and the collapse in implied volatility after the print removed more value than the price change added. Being directionally right does not guarantee an options gain.
What is the implied move and how is it calculated?
It is a movement size derived from the prices of options expiring shortly after the event. Premium Edge compares that priced movement with a stated historical sample for the same ticker. It describes what the market is charging, not what will happen.
Does a large implied move mean the stock will move that far?
No. It means options are priced for a wider distribution of outcomes. Actual moves are frequently smaller or larger than the priced move, and a rich price is not a forecast.
Can I tell whether pre-earnings put buying is bearish?
Not from volume alone. Put volume rises before earnings from ordinary downside protection on long stock as readily as from bearish speculation, and both add identically to the totals. Execution location narrows the estimate but never confirms it.
When does open interest confirm what happened on the event day?
The following morning. Open interest publishes once daily after the close from OCC, so the event session's positioning change is visible only in the next day's figures, and even then it shows size rather than side.