


Options volume scanner: reading a volume spike correctly
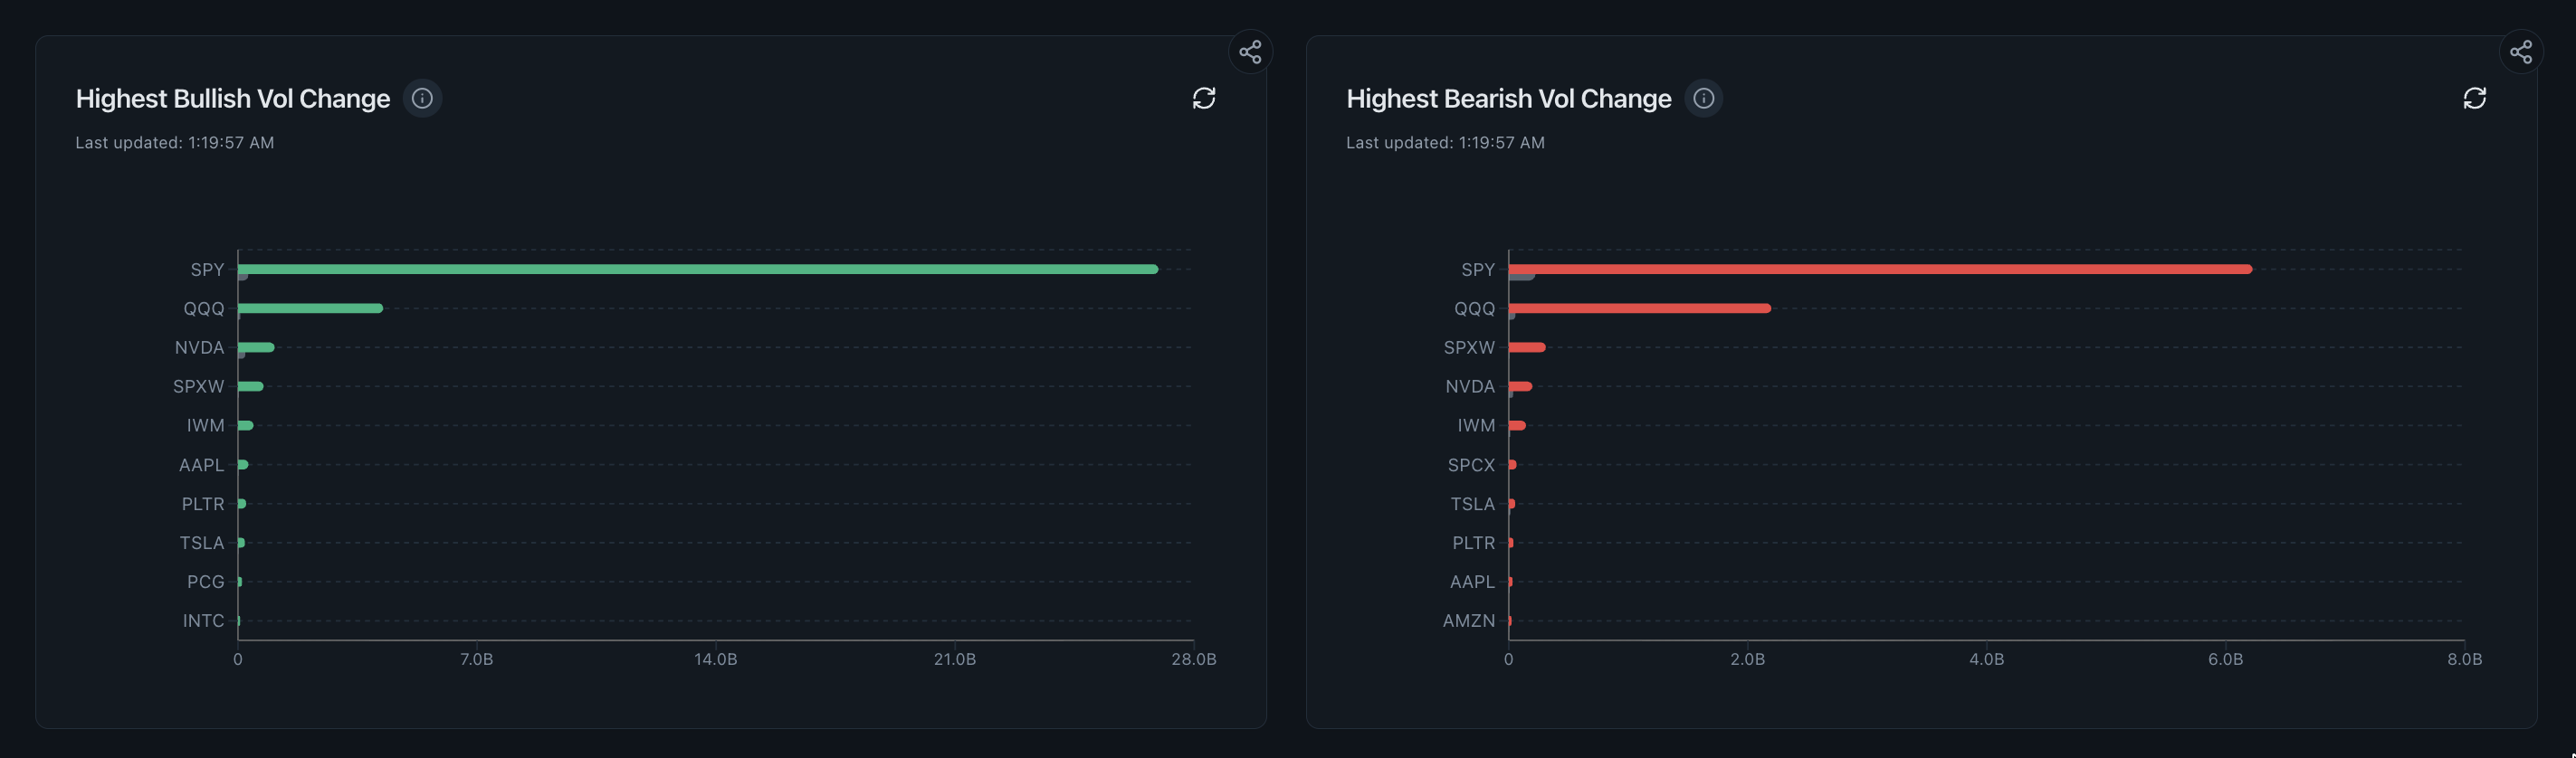
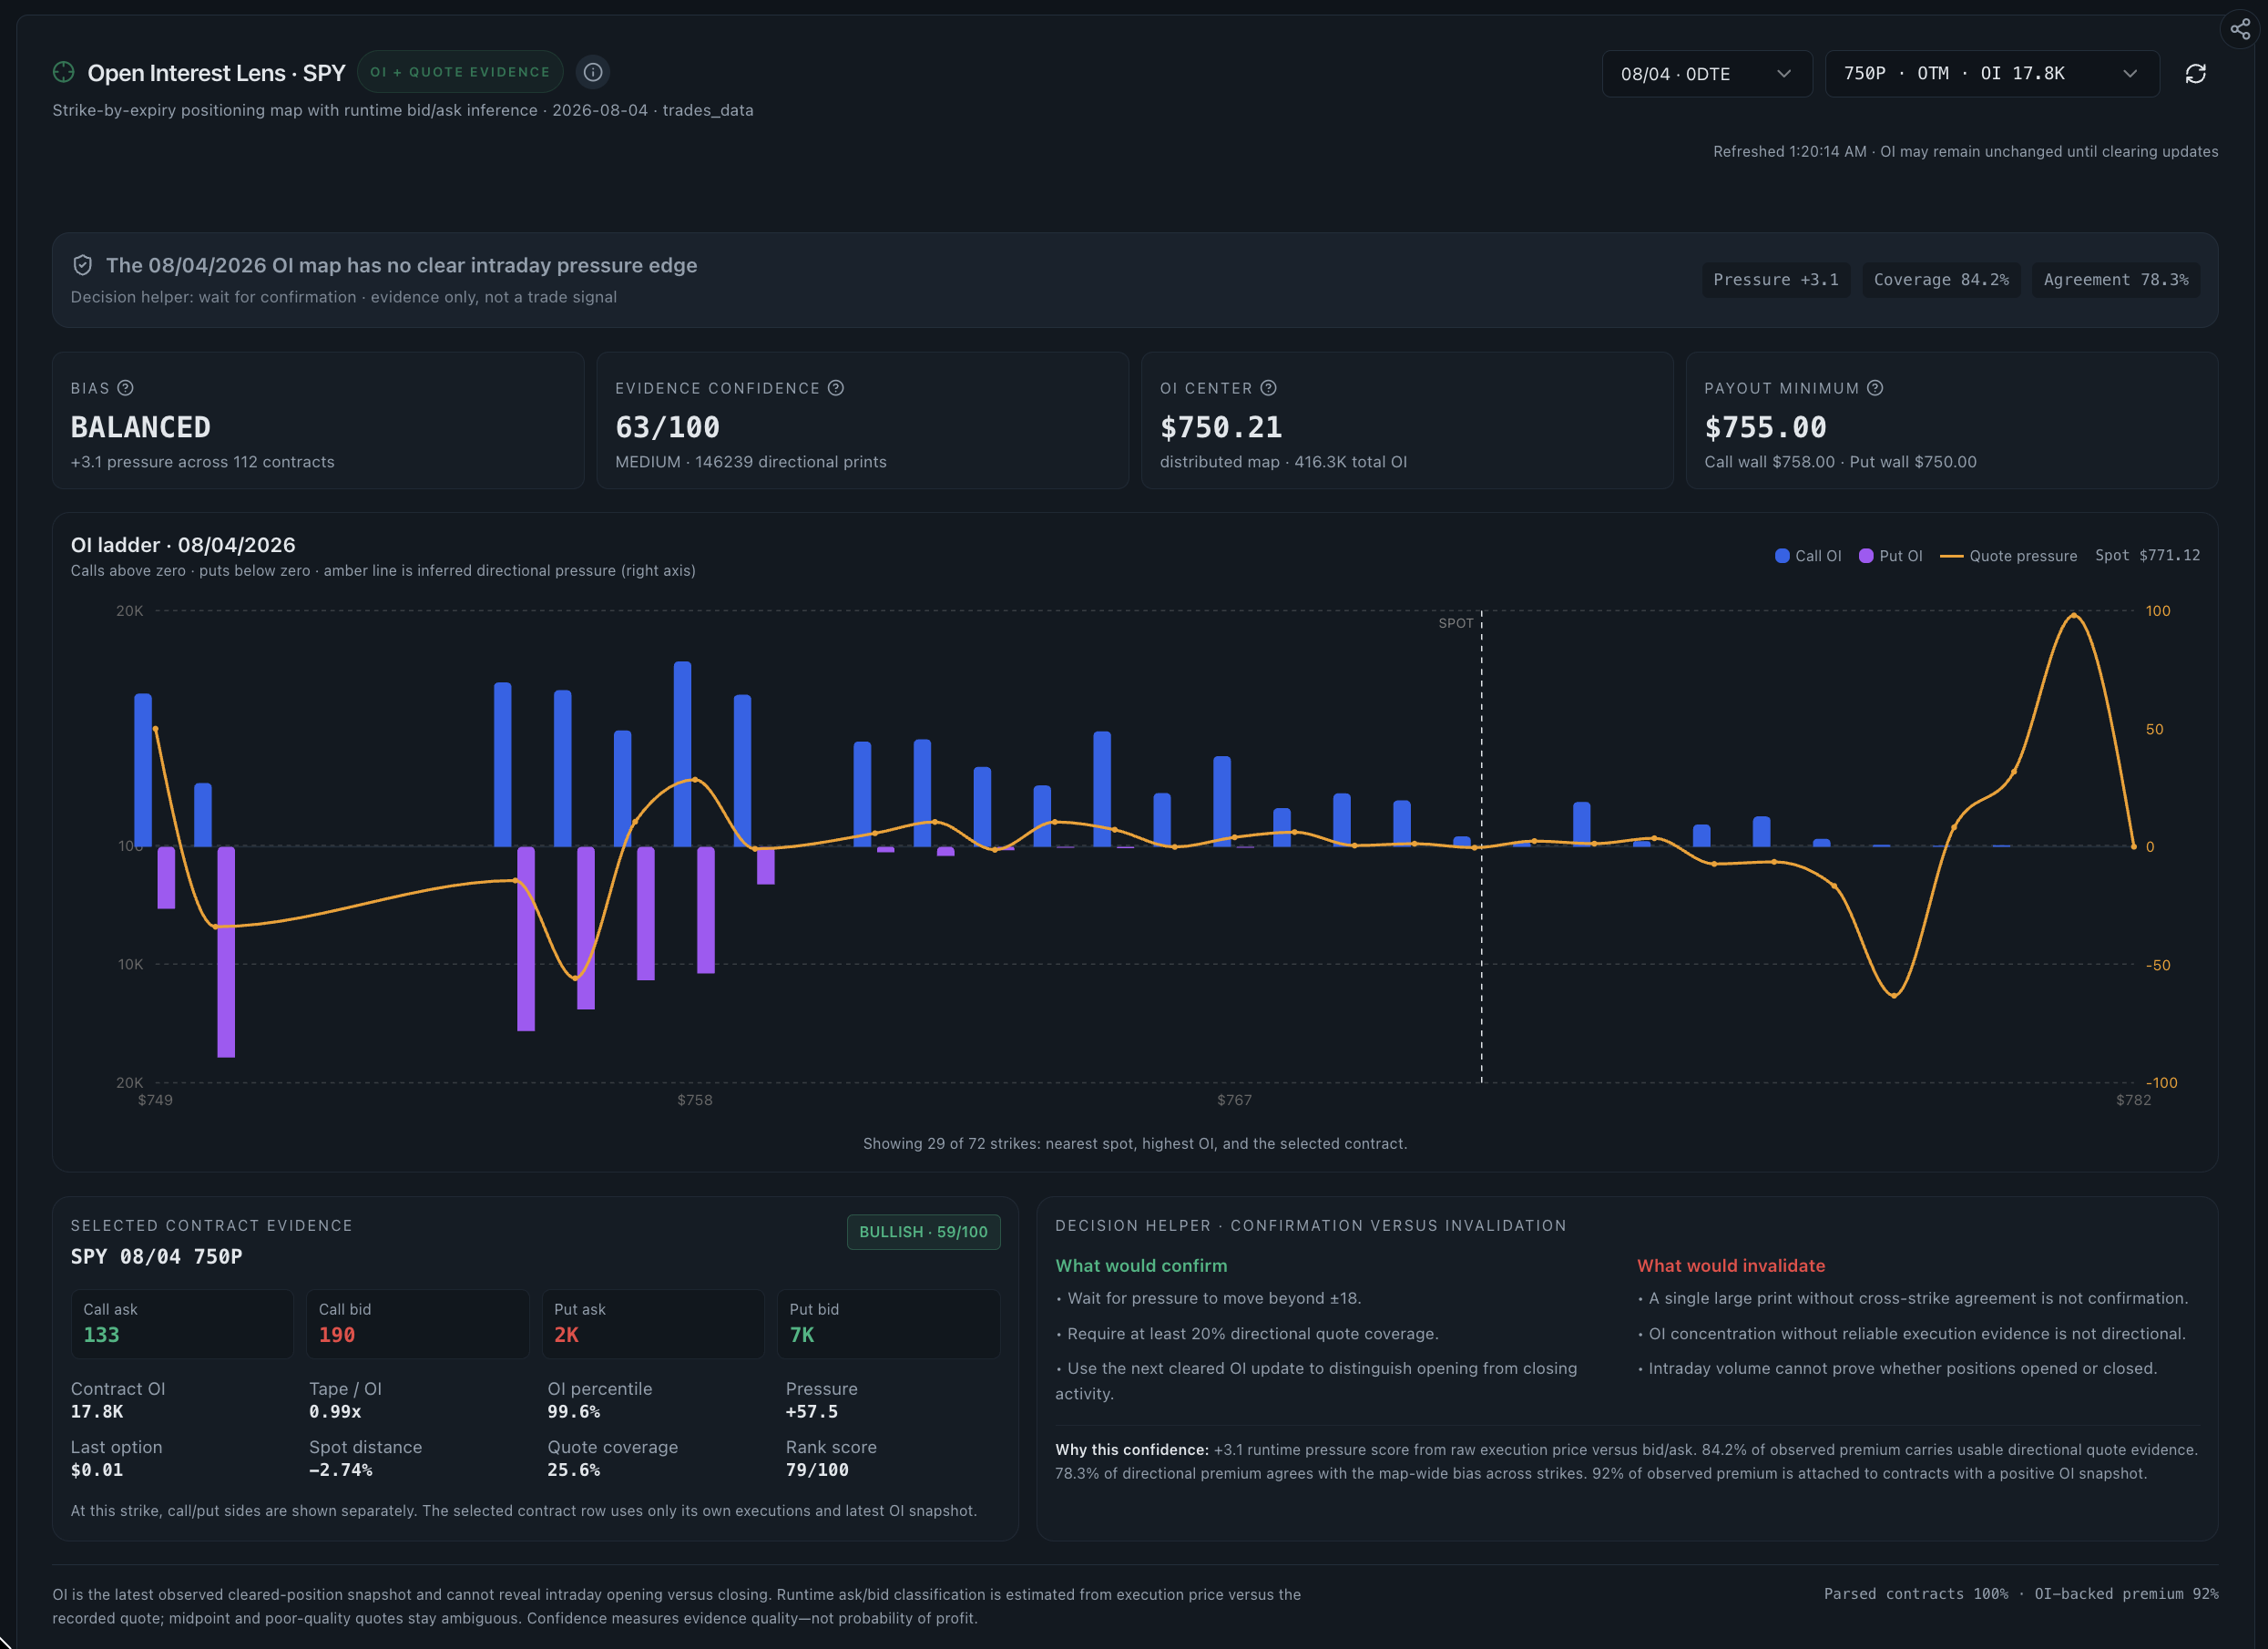
An options volume scanner ranks contracts and tickers by how much trading occurred, usually against their own recent average, so unusually active strikes surface without reading the chain by hand. Options volume is the most misread number in the market: it counts contracts traded, not positions opened, not dollars committed and not direction. Realtime Options shows volume change beside premium, trade count and open interest, so the same spike can be read four ways before anyone interprets it.
- Measures
- Contracts traded during the session
- Does not measure
- Direction, positioning or money committed
- Read alongside
- Trade count, premium and open interest
- Open interest timing
- Once daily after the close via OCC, never intraday
- Product view
- Options Volume Change
- Keep in mind
- A spike is a prompt to research, not a signal
What an options volume scanner measures
An options volume scanner counts contracts that traded and compares that count to a baseline, usually the contract's or ticker's own average over a recent window. The output is a relative measure: 40,000 contracts is unremarkable in SPY and extraordinary in a thin single name, so the absolute number alone means nothing.
Read the supporting context
Scanners differ in what they rank. Some rank individual contracts, some rank tickers by aggregate volume, and some rank the ratio of today's volume to yesterday's open interest. Those three lists rarely contain the same names.
- Contract-level: which specific strike and expiry traded far above its own average.
- Ticker-level: which underlyings saw aggregate options activity rise across the chain.
- Ratio-level: where today's volume is large relative to the contracts already outstanding.
- Directional split: how the activity divided between calls and puts, which is not the same as bullish and bearish.
Four numbers that get confused with each other
Most misreadings of a volume scanner come from treating four different measurements as one. They answer separate questions and they routinely disagree, which is exactly what makes reading them together useful.
| Number | What it actually counts |
|---|---|
| Contract volume | Contracts traded in the session, including closes and rolls |
| Trade count | How many separate transactions produced that volume |
| Premium | Dollars committed: price multiplied by contracts multiplied by 100 |
| Open interest | Contracts outstanding after clearing, updated once daily after the close |
| Volume to open interest ratio | How today's activity compares with existing positioning |
Volume spike with flat open interest versus rising open interest
This is the question a volume scanner exists to set up and cannot itself answer. Volume tells you activity occurred; only the change in open interest tells you whether positioning grew. Because open interest is published once daily after the close by OCC, the confirmation always arrives the following morning.
Read the supporting context
The readings below are the most consistent interpretations, not certainties. Each remains an estimate because opening and closing transactions are not separately reported, and a single day can contain both.
| What the next morning shows | Most consistent reading |
|---|---|
| High volume, open interest up by a similar amount | Most of the activity opened new positions |
| High volume, open interest roughly unchanged | Opens and closes largely offset, or positions were round-tripped intraday |
| High volume, open interest down | Activity was dominated by closing existing positions |
| Volume far exceeding prior open interest | Much of the day's trading cannot all be new positioning; expect intraday turnover |
| 0DTE contracts | Open interest never confirms them; they expire before the next update |
A reading order that survives contact with a busy session
Scanning without a fixed sequence produces confident conclusions from whichever number was loudest. The order below deliberately puts the contradicting evidence before the interpretation.
- Establish the market backdrop before looking at any single name.
- Read the volume change relative to the ticker's own baseline, not to other tickers.
- Check trade count: separate one block from hundreds of small prints.
- Check premium: confirm whether the volume represented meaningful dollars.
- Locate the activity on the chain by strike and expiry.
- Check open interest at that strike from the previous close, and note that it lags.
- Check price behaviour and any scheduled catalyst before writing anything down.
What makes a volume spike meaningless
Several routine, non-informative activities generate large volume. Recognising them removes most false positives from a volume scanner before any interpretation begins.
Read the supporting context
The most common of these is calendar-driven. Expiration days concentrate closes and rolls, and the week before a scheduled earnings report concentrates hedging. Neither carries a directional message, and both look identical to conviction in a volume ranking.
- Expiration days, where volume is dominated by rolls and closing transactions.
- Pre-earnings hedging, which inflates activity without expressing a view.
- Thin single names, where a handful of trades can swing a percentage change.
- 0DTE contracts, which produce large volume that never becomes open interest.
- Market-maker inventory management, which adds volume on both sides with no opinion.
What a volume scanner cannot tell you
Volume is a count. It contains no direction, no owner and no intent. Heavy call volume is not evidence that a stock will rise, because call buying can hedge a short position, roll an expiring contract or form one leg of a delta-neutral structure, and call selling adds identically to the same number.
Read the supporting context
Realtime Options presents volume change as observed activity with the surrounding evidence attached. It produces no buy or sell signals, no alerts framed as recommendations and no forecast, and it does not offer backtesting to imply that a past volume pattern repeats.
- Whether the contracts were bought or sold to open.
- Whether the activity opened or closed positions, until open interest updates.
- Whether the volume belonged to a spread, a roll or a hedge.
- Whether the participant was directional, neutral or hedging exposure elsewhere.
Common questions
What is an options volume scanner?
An options volume scanner ranks contracts or tickers by how much trading occurred relative to their own recent baseline, so unusually active strikes surface without manual chain reading. It measures activity, not direction and not positioning.
What does unusual options volume mean?
It means a contract or ticker traded far above its own normal activity level. That is a prompt to look closer at strike, expiry, premium, trade count and open interest. It is not evidence of informed trading and it is not a signal.
What does it mean when volume is higher than open interest?
It means the day's trading exceeded the contracts outstanding at the previous close, so a large share of the activity was either newly opened positions or intraday round trips. The next open-interest update, published after the following close, is what separates the two.
Does high call volume mean the stock is going up?
No. Call volume counts contracts traded, not buyers. Calls can be bought as a hedge against short stock, sold for income against shares held, rolled from an expiring position or traded delta-neutral against futures. All of it looks the same in a volume number.
How often does open interest update?
Once daily, after the close, through OCC. No vendor provides intraday open interest, because it does not exist until positions clear. Any tool implying live open interest is showing something else, usually cumulative volume.
Is options volume the same as premium?
No. Volume counts contracts; premium counts dollars. Ten thousand contracts at $0.05 is $50,000 of premium, while five hundred contracts at $8.00 is $400,000. Ranking by volume and ranking by premium produce different lists.
Can a volume scanner work on delayed data?
Yes, for end-of-day and next-morning review, because the comparison is against a session total rather than a live tick. During the Realtime Options trial the data is delayed 15 minutes; Pro is near real time at $29 per month.