


Why options volume alone misleads
A contract volume number is a sum, and sums destroy the structure that made them interesting. Five thousand contracts at one strike can be a single negotiated block, a sweep filled across venues, five thousand separate one-lots, or the same few hundred contracts changing hands repeatedly through the day. Volume alone cannot distinguish those cases. Trade count separates structure, premium measures money committed, and the next open-interest print is the only field that says whether positioning actually grew.
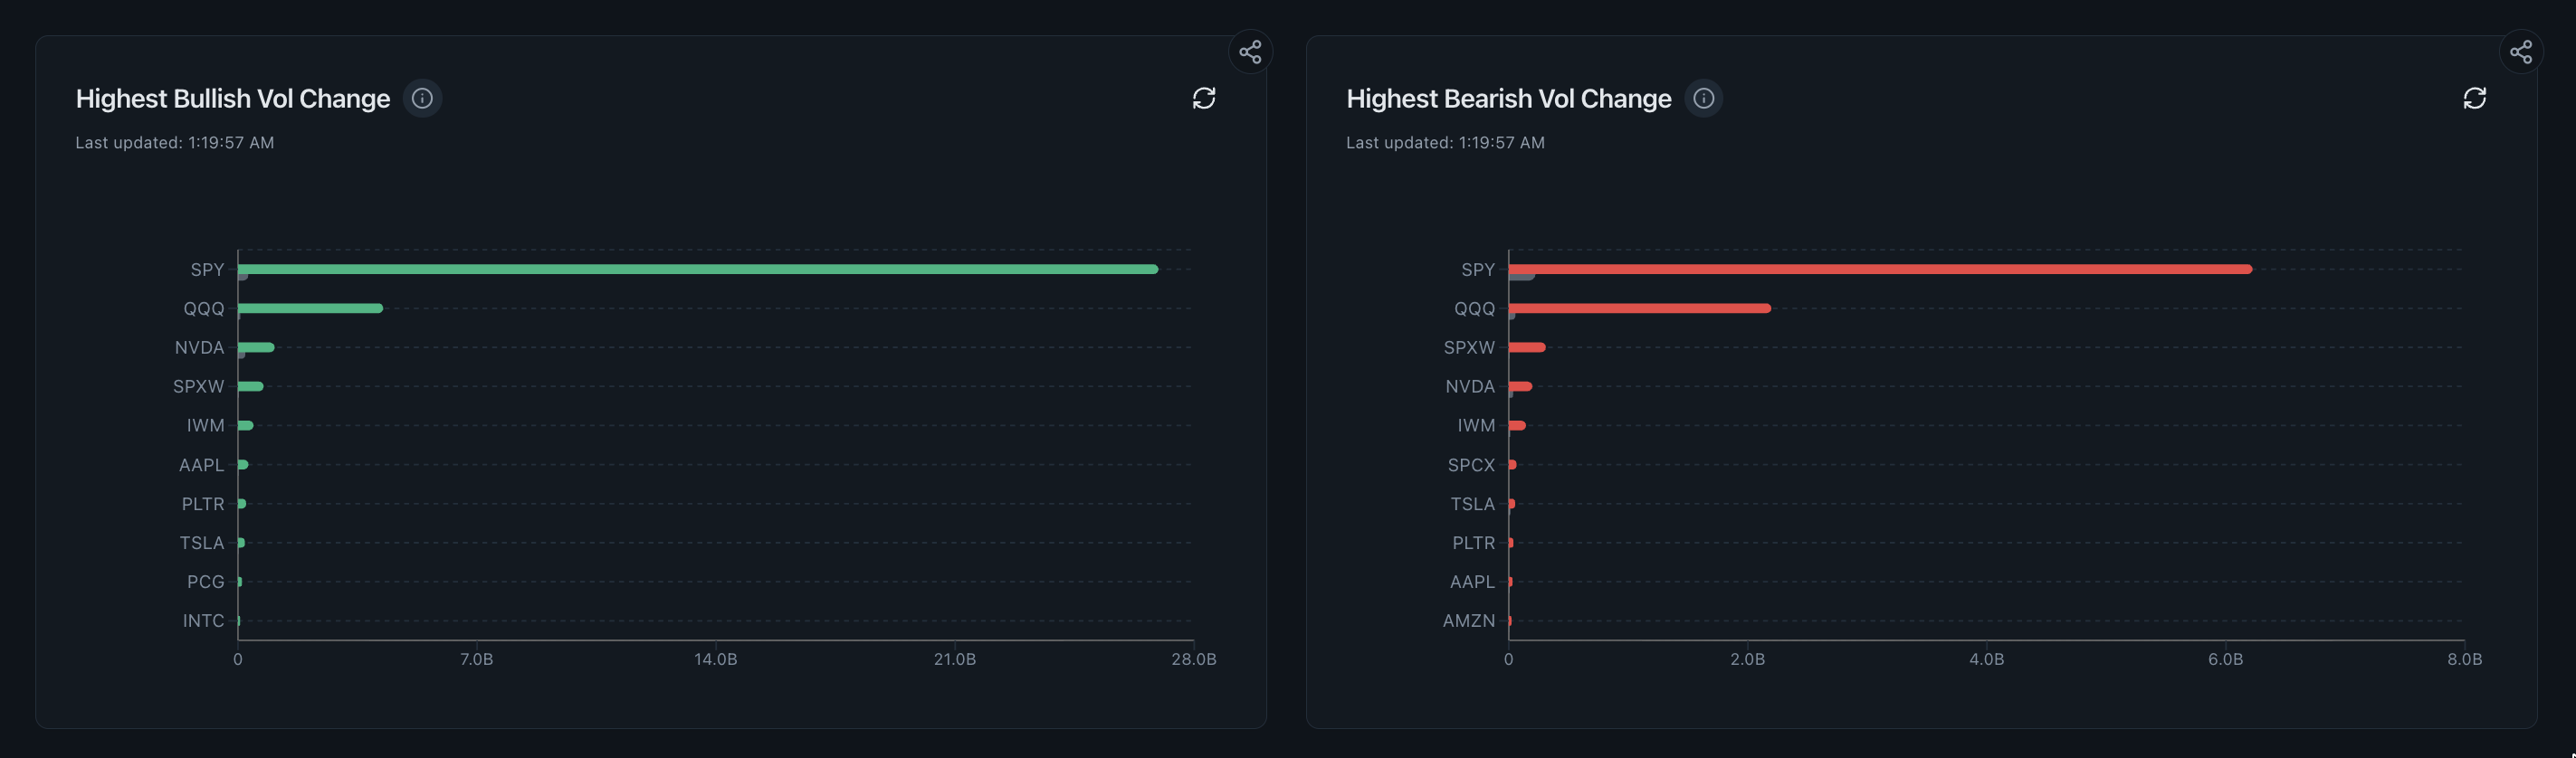
- Volume measures
- Contracts transacted, counted once per trade
- Volume cannot separate
- One block from thousands of one-lots
- Minimum companion fields
- Trade count, premium and open-interest change
- Open-interest cadence
- Once daily after the close, never intraday
- Still unresolved
- Who traded, why, and whether it was one leg of a spread
How can the same 5,000 contracts represent four different tapes?
Take a single strike showing 5,000 contracts of session volume. That number is compatible with at least four structurally different tapes, and the research implication differs in each case. A scanner that ranks by volume alone treats them as identical, which is the mechanical reason volume-only rankings feel noisy.
Read the supporting context
The point is not that one of these structures matters and the others do not. It is that volume has already thrown away the field that would let you tell them apart.
| Structure behind 5,000 contracts | What it suggests, and what it still does not |
|---|---|
| One 5,000-lot block | A single negotiated transaction; suggests a sizeable participant but not side, purpose or whether it is one leg |
| A sweep filled across venues in seconds | Urgency about completion; may still be a hedge, a roll or a closing trade |
| Five thousand separate one-lots | Broad participation or automated activity; the aggregate says nothing about any one participant |
| Three hundred contracts recirculating all day | Active two-way trading in a liquid series; positioning may be essentially unchanged |
Why is trade count the first missing field to add?
Dividing volume by trade count gives average trade size, which separates the four tapes above. It is simple to compute wherever individual prints are available, yet it is missing from most volume rankings. A 5,000-contract strike with three trades is a different observation from one with 1,900 trades.
Read the supporting context
Average size is a description, not a verdict. Large average size is consistent with institutional participation and also with a market maker managing inventory, a closing transaction, or one leg of a multi-leg order that was worked as a block.
- Volume divided by trade count gives average contracts per print.
- A small trade count with large volume points to blocks or worked orders.
- A large trade count with the same volume points to fragmented or automated activity.
- Neither pattern identifies the participant, and neither establishes direction.
- Sweeps sit between the two, since one order can produce many prints across venues.
How does premium make options volume more comparable?
Contract counts are not comparable across strikes and expiries, because contracts are not the same size in money terms. Premium, which is contracts multiplied by the option price and the 100-share multiplier, restores comparability. The same 5,000 contracts can represent well under a hundred thousand dollars in a cheap same-day strike and several million in a long-dated one.
Read the supporting context
This is why a leaderboard ranked by contract volume drifts systematically toward the cheapest contracts on the board, and why a leaderboard ranked by premium looks different almost every time.
- Premium equals contracts multiplied by option price multiplied by 100.
- Cheap short-dated contracts inflate contract counts relative to money committed.
- Expensive long-dated contracts do the reverse.
- Premium is money that changed hands, not net risk taken, and both sides of a trade contribute to it.
- A separate post works through the arithmetic in full.
What does the next open-interest change confirm?
Trade count and premium describe the structure and size of activity. Neither says whether positioning grew. Only the change in open interest does that, and it is published once daily after the close by OCC, after opening and closing activity has been reported and exercise and assignment processed.
Read the supporting context
The mechanics are simple and frequently forgotten. A trade always has a buyer and a seller, but it does not always create an outstanding contract. If one participant opens while the other closes, open interest is unchanged no matter how large the print. This is the specific reason an intraday claim that a trade definitely opened a position exceeds what public data can support.
| Volume and next-day open interest | Reading that is supported |
|---|---|
| High volume, open interest rises by a similar amount | Consistent with substantially new positioning at that series |
| High volume, open interest roughly unchanged | Consistent with transfer between participants; positioning may not have grown |
| High volume, open interest falls | Consistent with closing activity, including rolls into another expiry |
| High volume with an offsetting move at another strike | Consistent with a spread or roll rather than an outright position |
| Any of the above | Still silent on who traded, on which side, and for what purpose |
Which four decompositions should come before interpreting options volume?
None of these steps requires a specialist product. They require the fields to be present on the same screen, which is the practical reason a bare volume feed produces confident readings and a decomposed one produces careful ones.
- Divide by trade count to recover average print size.
- Convert to premium so the number can be compared with other strikes and other tickers.
- Compare with the contract's own recent baseline rather than a fixed market-wide threshold.
- Check the following day's open-interest change before describing anything as new positioning.
- Look for a matching print at another strike or expiry that would make the trade one leg of a structure.
What remains unresolved after decomposing options volume?
Even with trade count, premium and the settled open-interest change, several questions remain permanently open. The public tape does not name the beneficial owner, does not show the rest of the portfolio, and does not reveal whether an option position offsets stock, futures or another option held elsewhere.
Read the supporting context
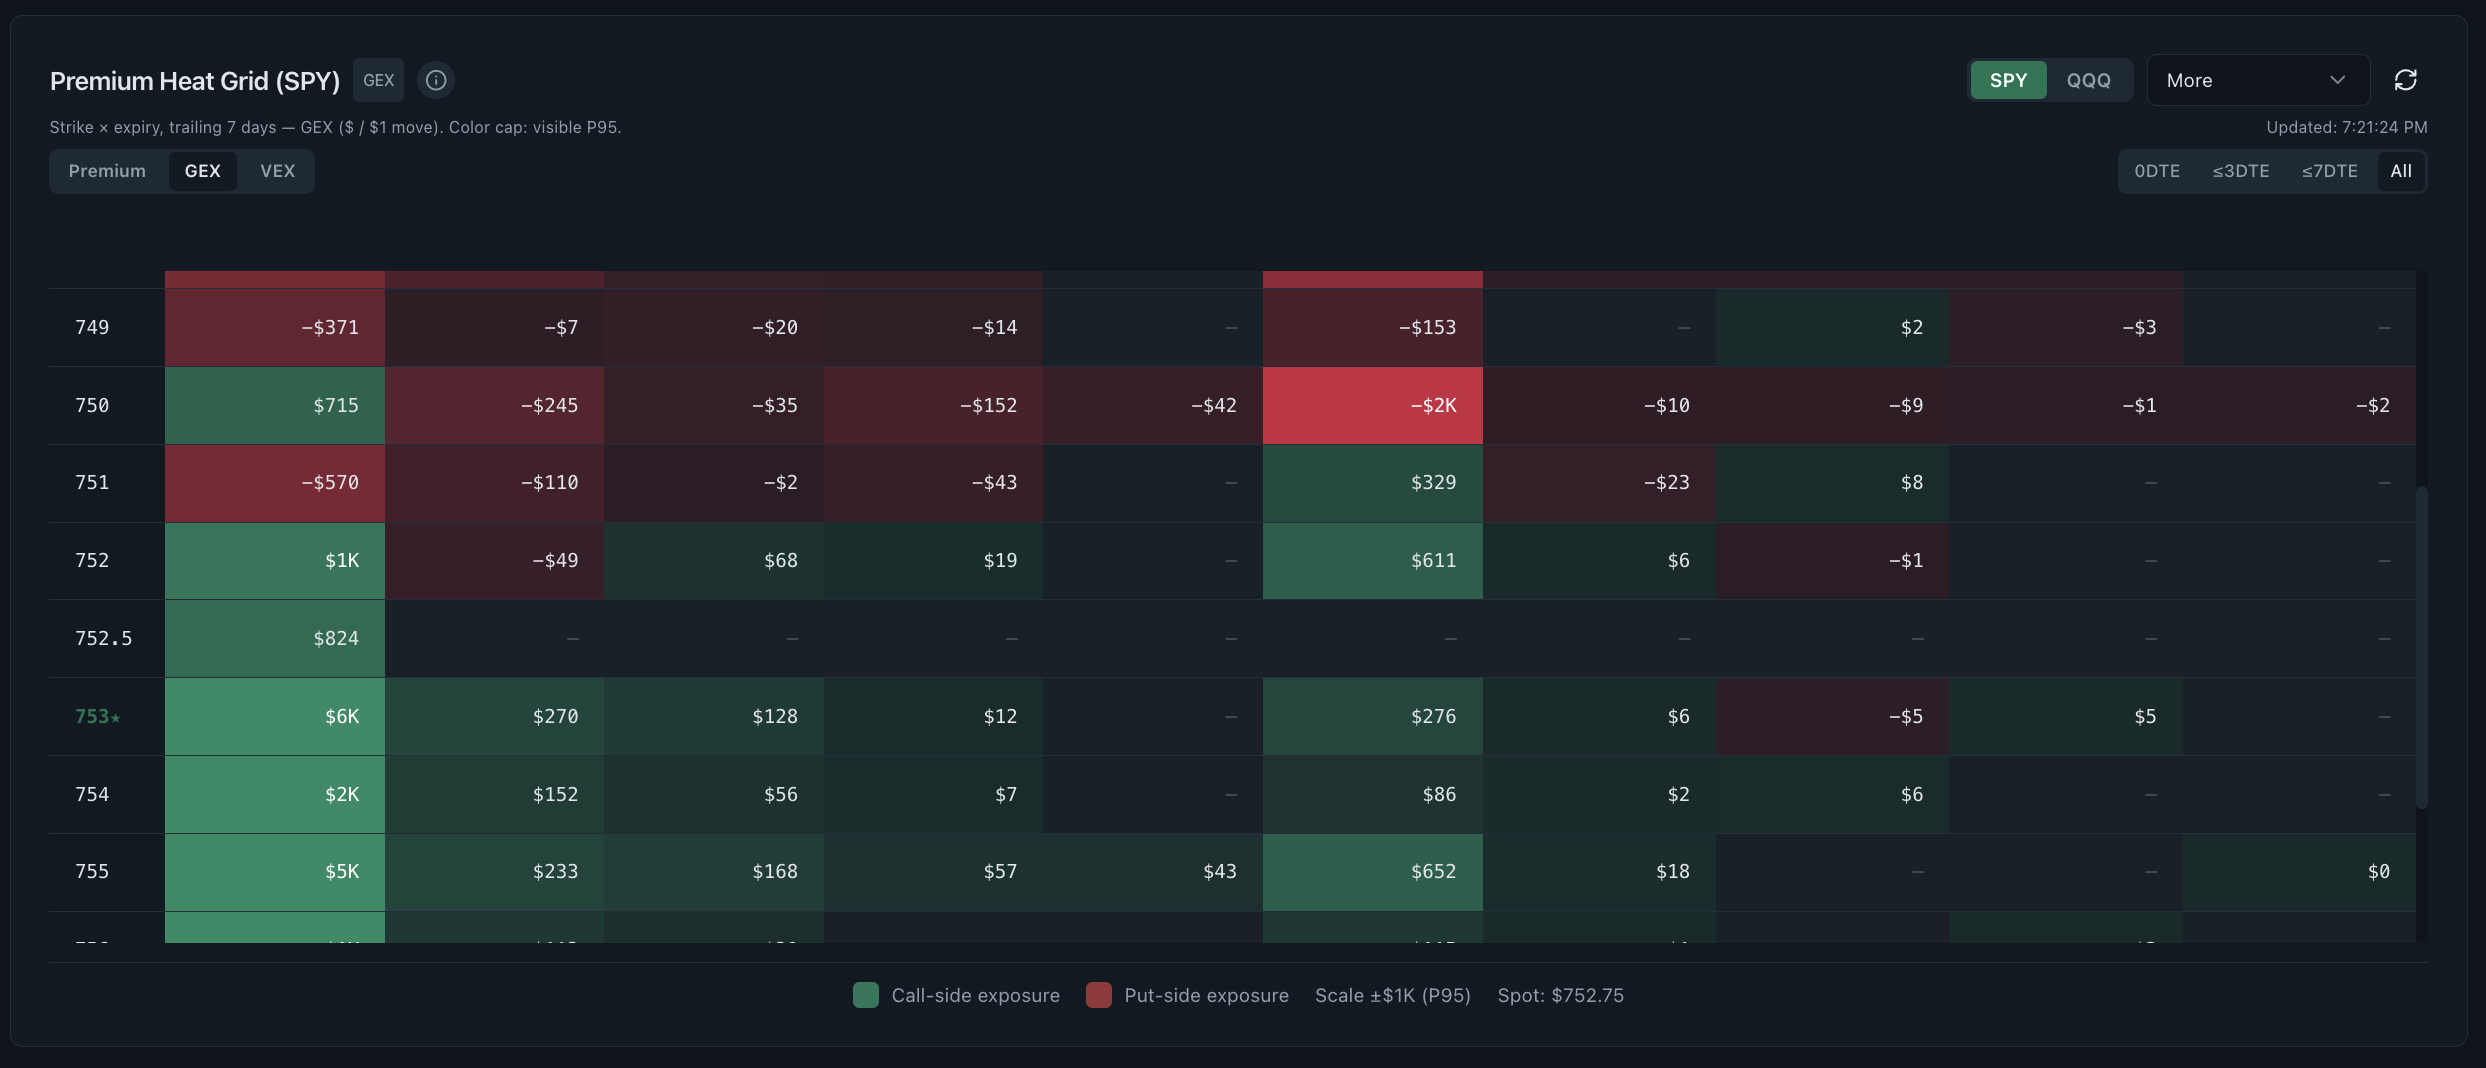
Realtime Options is built around this limitation rather than against it. It provides dashboards that put volume, trade structure, premium, open interest, exposure and price in the same workflow. It has no raw option-chain quote screen, no backtesting and no order entry; its Pro-only Public API v1 is limited to authenticated, read-only aggregated Buy/Sell Pressure, Algo Flow, 0DTE Flow & Gamma Exposure, and Greeks by Strike analytics. No row is labelled as a trade to take.
- Aggressor side is estimated from quote location and remains an estimate.
- Opening versus closing status cannot be confirmed intraday.
- Spread legs frequently print separately and can be counted as unrelated activity.
- Beneficial owner, portfolio context and intent are not in the dataset at all.
Common questions
Why is options volume alone a poor measure of conviction?
Volume is a sum of contracts and discards the structure of the trades that produced it. One 5,000-lot block and five thousand one-lots produce the same number, as does the same small position changing hands repeatedly. Trade count, premium and the next open-interest print are what separate those cases.
What is a good average trade size in options flow?
There is no universal figure, because a normal print in SPY is not a normal print in a thin single-stock chain. Average size is only interpretable against the same contract's own recent history, which is why fixed market-wide thresholds tend to surface the most liquid names rather than the most unusual activity.
Can options volume be higher than open interest?
Yes, routinely. Volume counts every transaction, including the same contracts changing hands several times in a session, while open interest counts only the contracts that remain outstanding after clearing. A large ratio of volume to open interest is a prompt to check the next settled figure, not evidence of anything on its own.
Does high volume with unchanged open interest mean nothing happened?
It means positioning did not grow at that series, which is itself informative. Substantial activity occurred and exposure was transferred between participants, with one side opening while the other closed. That is a different observation from a new position being built, and it is often read as the latter.
Is volume or premium the better ranking field?
Premium is more comparable across strikes and expiries because it accounts for what the contracts cost, so a premium ranking does not drift toward the cheapest contracts on the board. Neither field establishes direction, and both count buying and selling identically.
Does Realtime Options rank contracts by volume?
It shows volume alongside trade structure, premium, open interest, modelled exposure and price rather than as a standalone ranking. No row in any dashboard is presented as a recommended trade, and the product does not issue signals, alerts framed as recommendations, or backtested results.