


How to read a week of SPY options flow
Reading a week of SPY options flow means separating the fields that reset every session from the ones that accumulate across the week. Intraday premium, trade count and estimated side are session-scoped and start again each morning. Open interest, strike concentration and repeat activity at the same series are the parts that carry over, and open interest only settles overnight, which means Friday's data changes how Thursday should have been read.
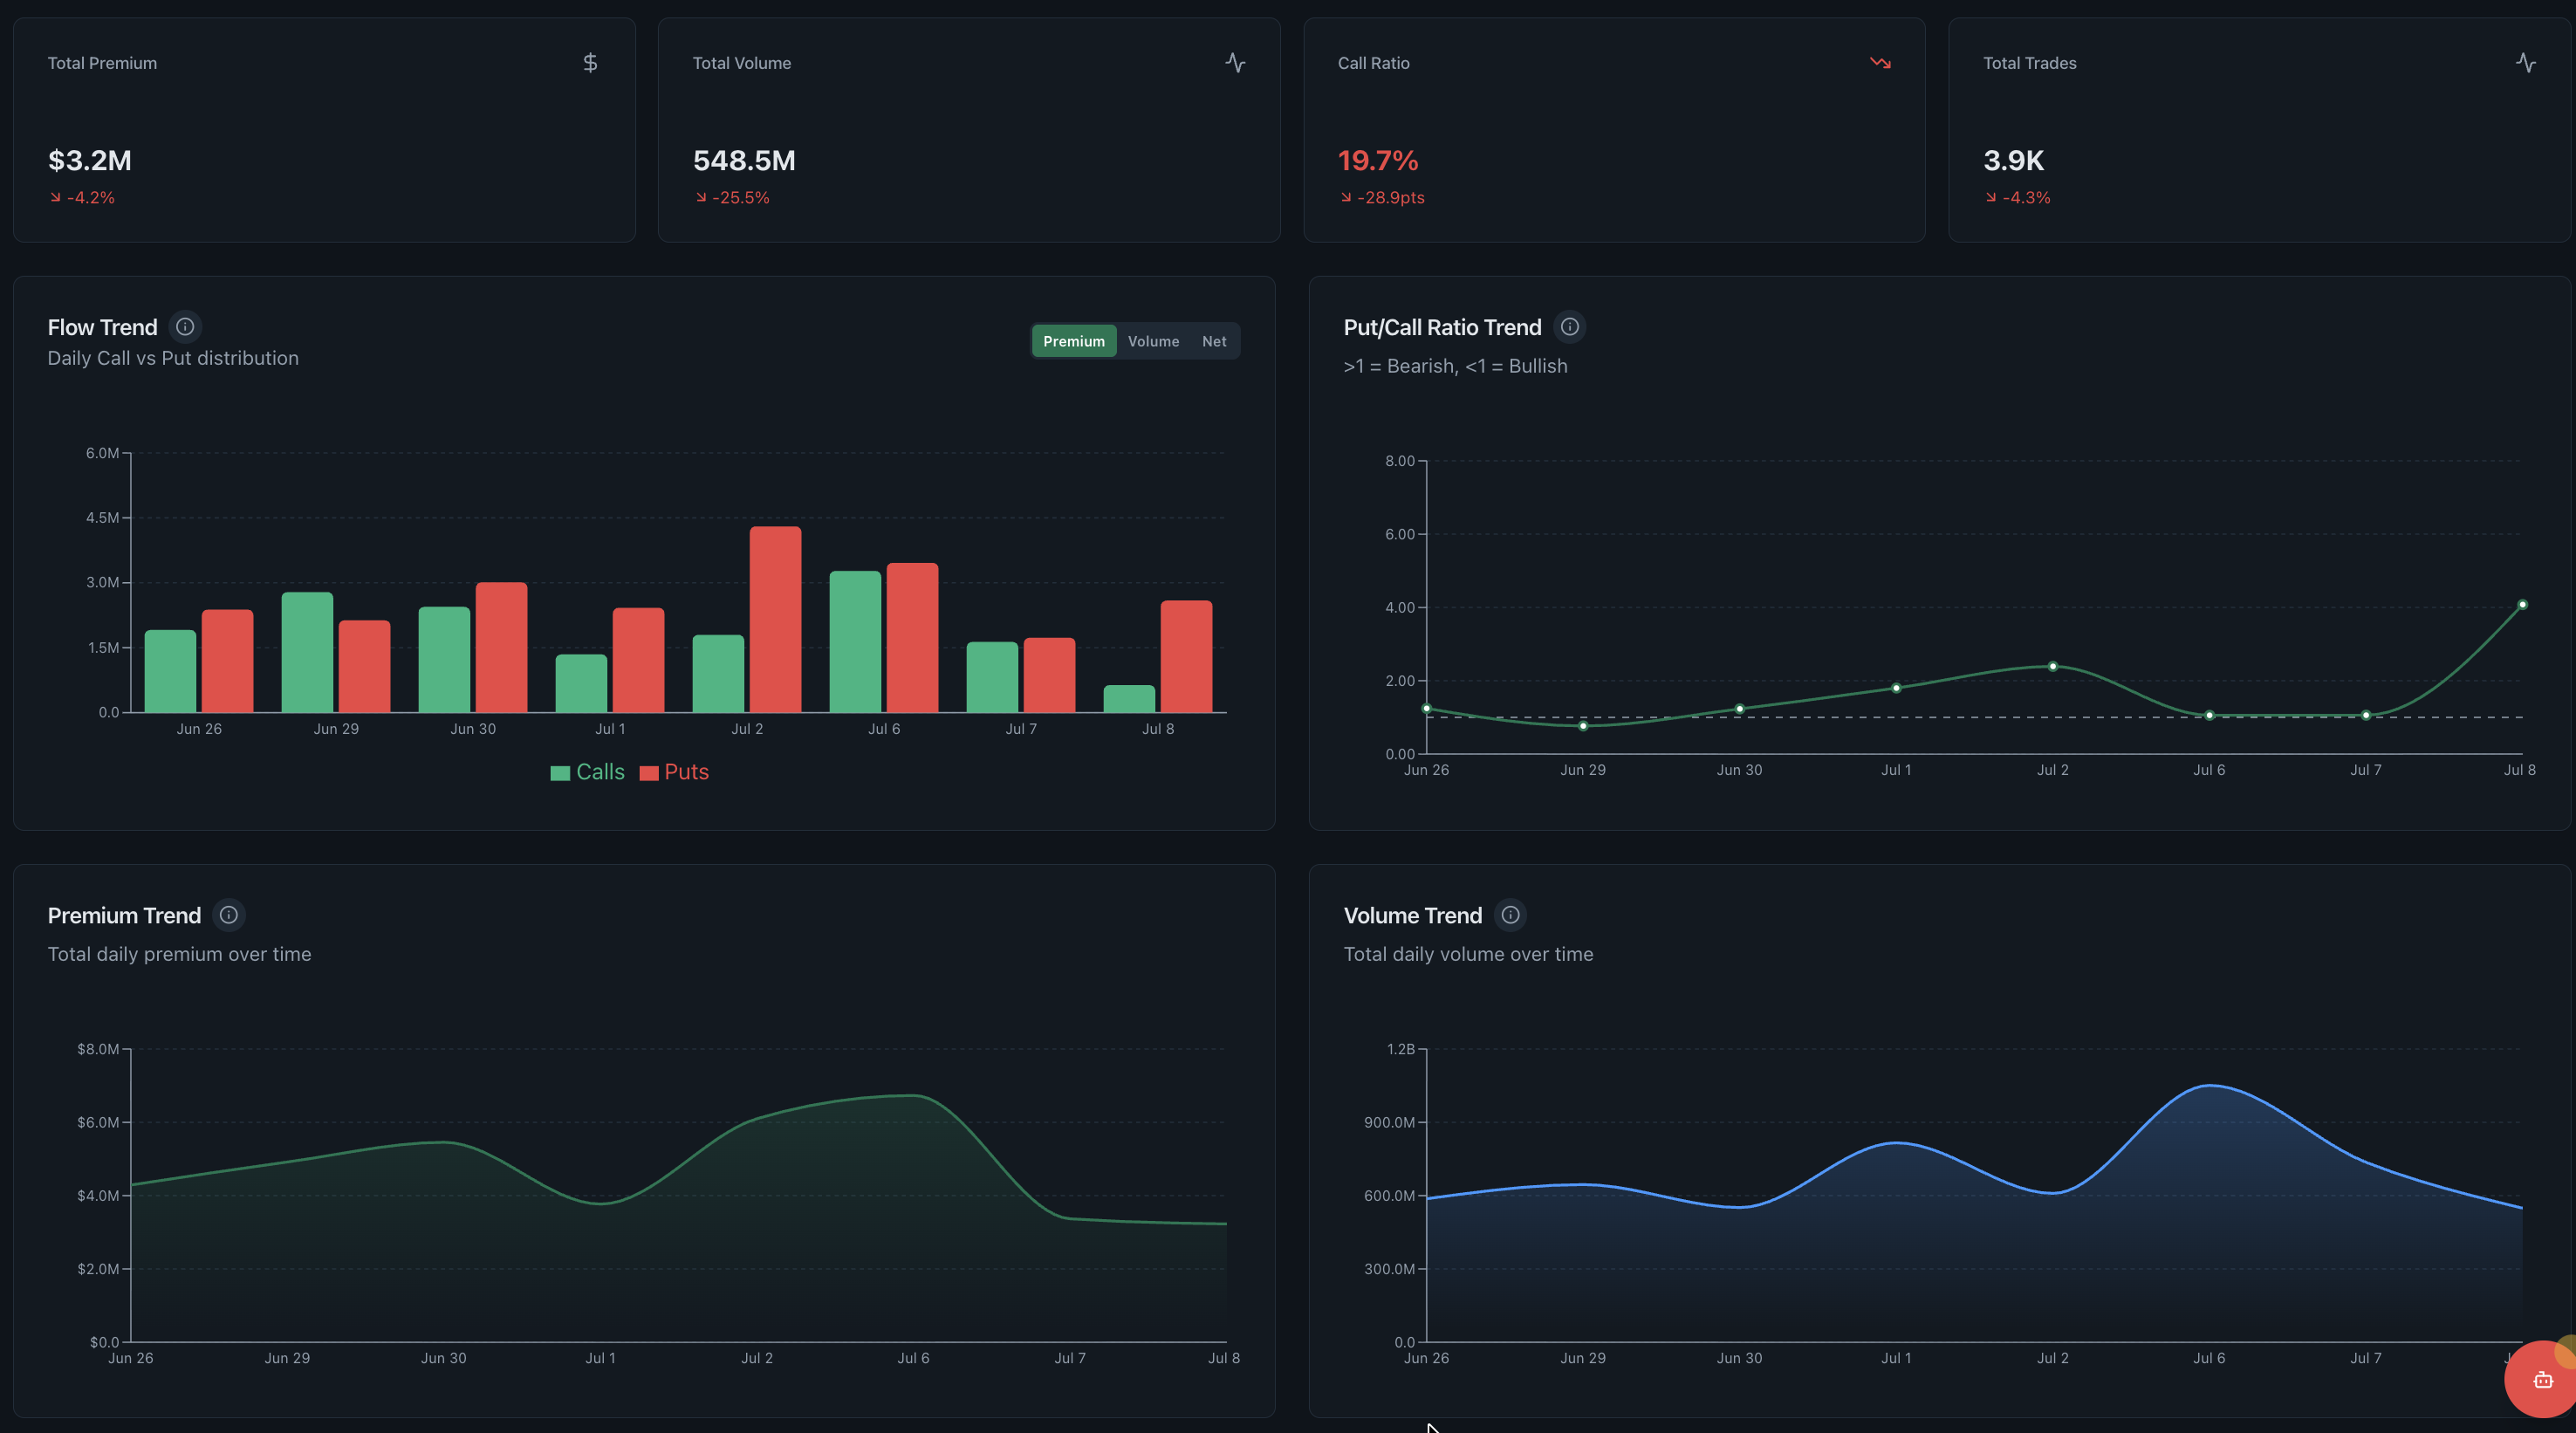
- Resets daily
- Volume, premium, trade count and estimated side
- Carries over
- Open interest, strike concentration and repeat series activity
- Settles overnight
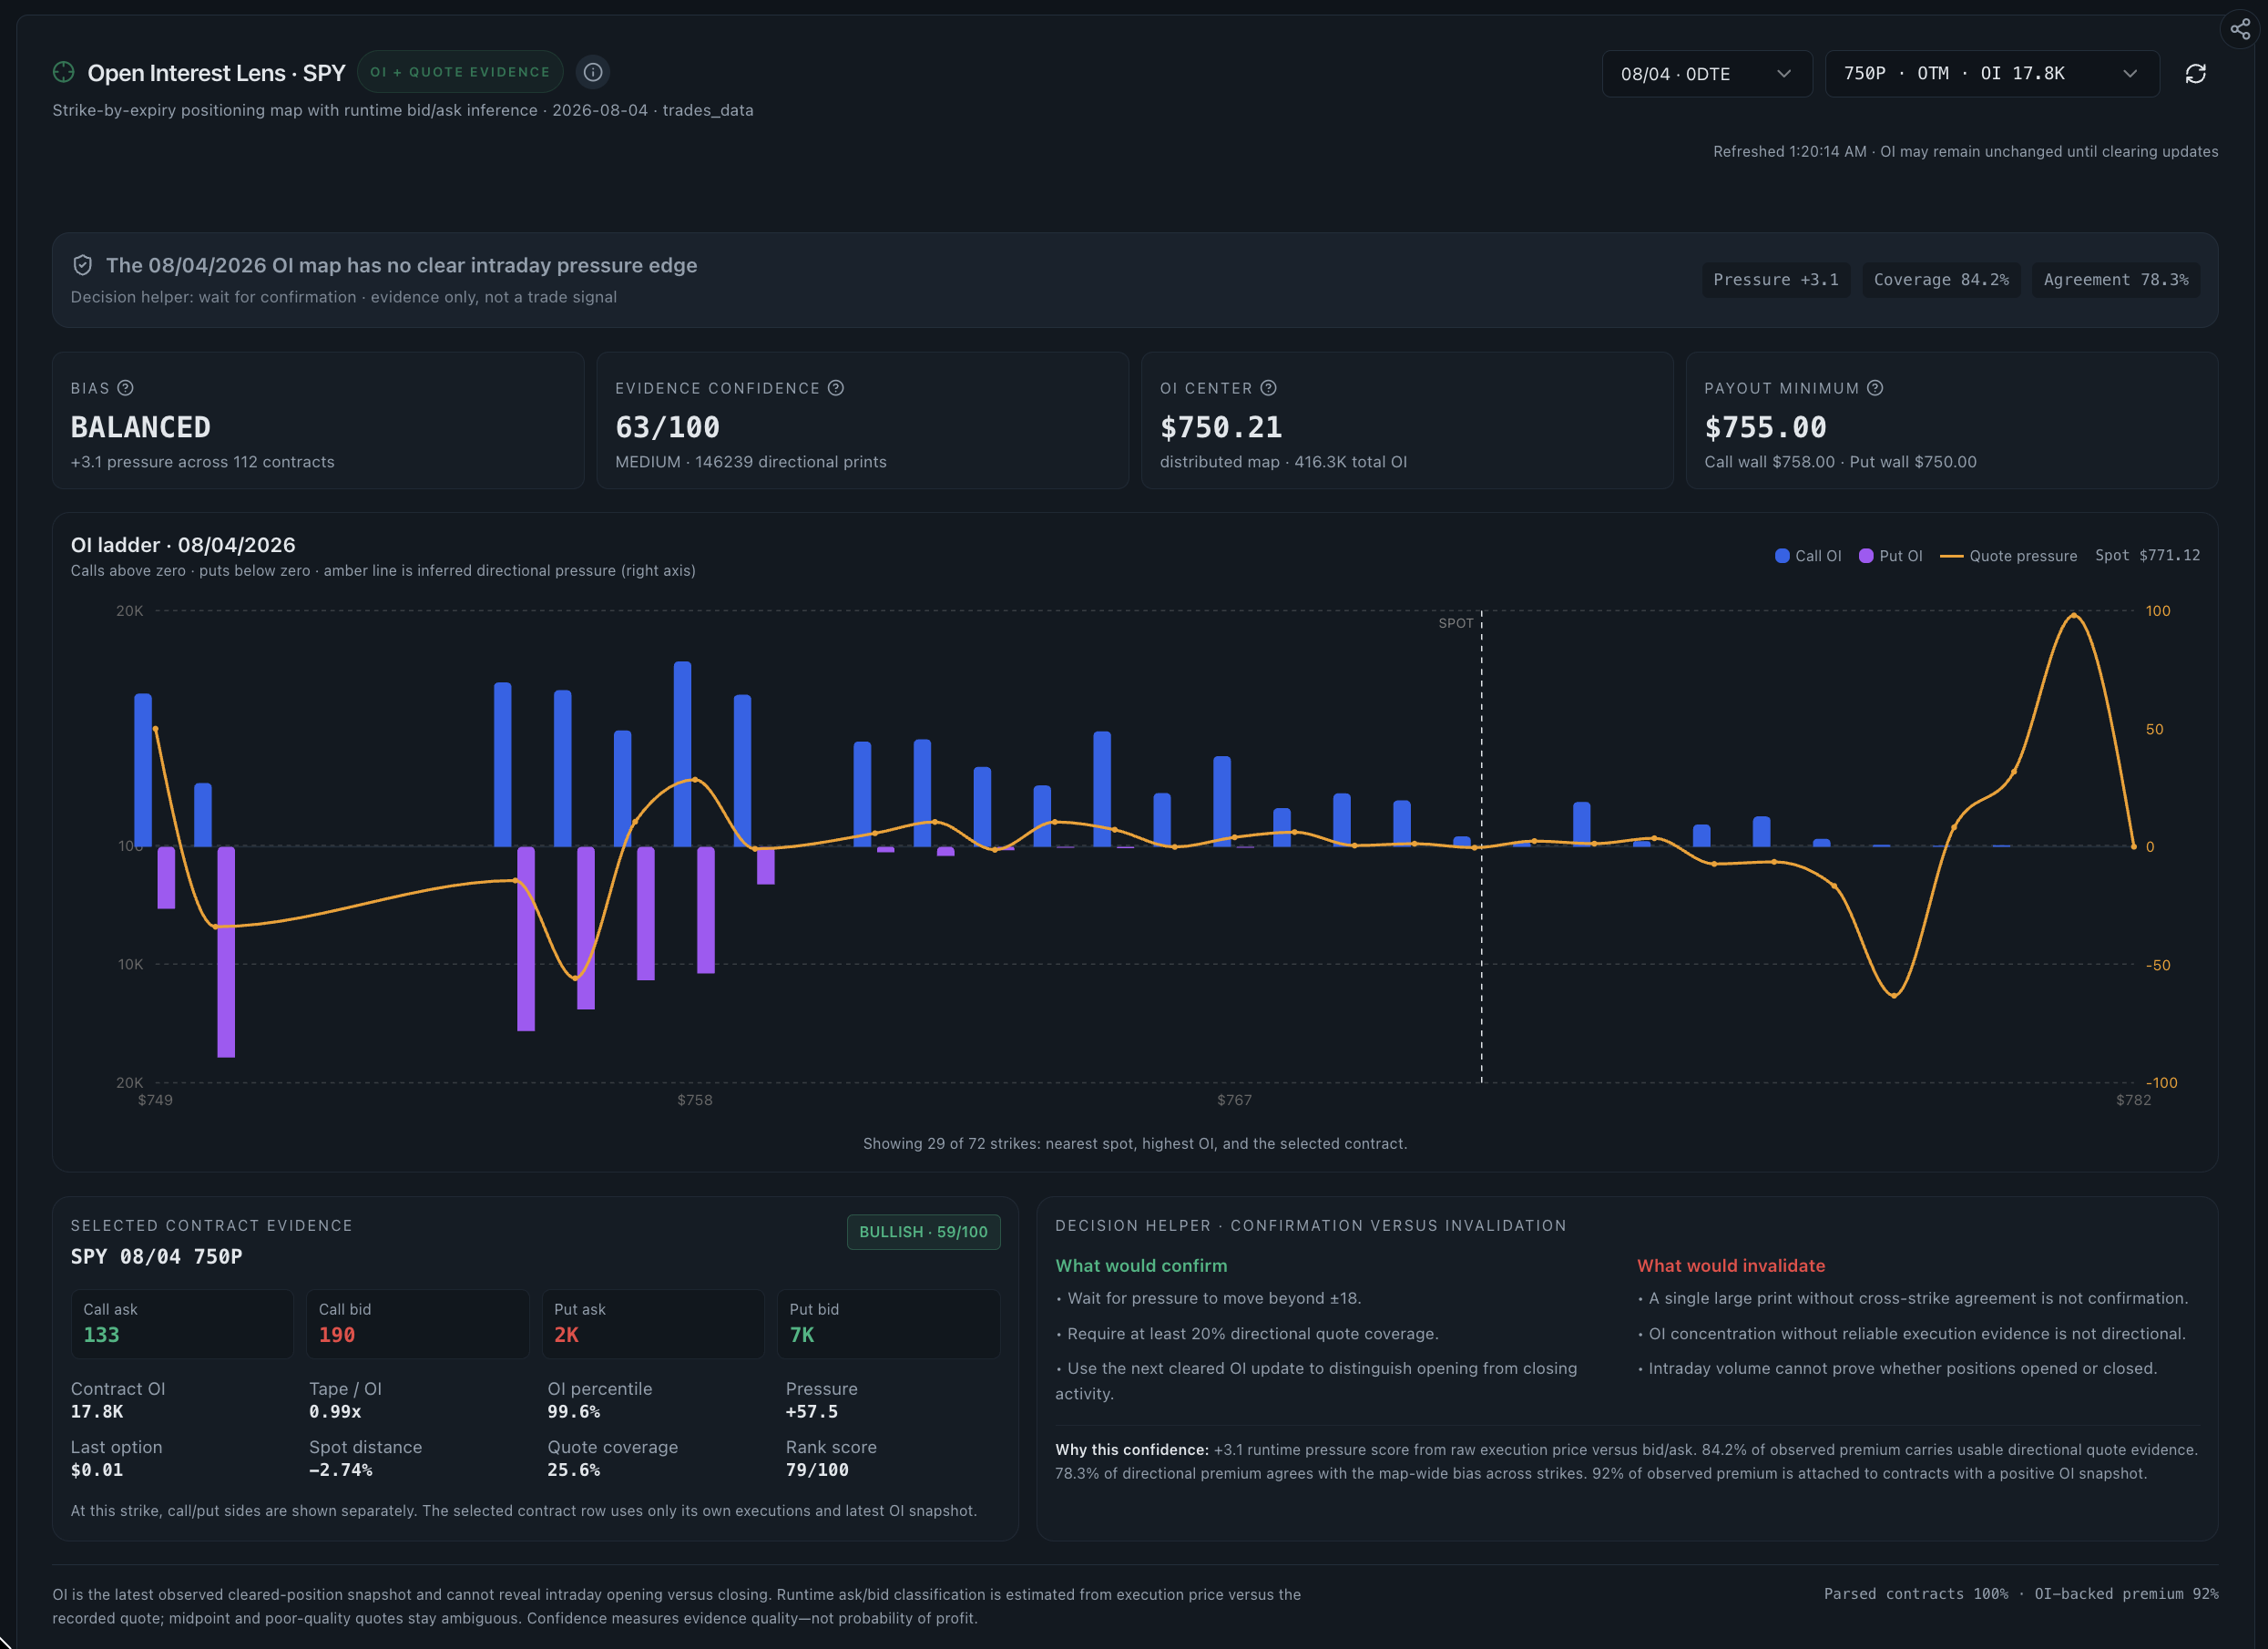
- Open interest, published once daily after the close by OCC
- Expiry cadence
- SPY lists an expiration on every trading weekday
- Not available
- Intraday open interest, from any vendor
- Output
- A weekly note describing evidence, never a forecast
What changes between Monday and Friday in SPY options flow?
A week of SPY options flow is not five comparable readings. Some fields are recomputed from zero at every open, some accumulate, and one of them, open interest, is only correct after the market has closed and OCC has processed the session. Confusing the three is the single most common cause of a weekly read that sounds coherent and is not.
Read the supporting context
Before comparing any two days, sort the fields by cadence. The comparison only means something when both sides of it are measured on the same clock.
| Field | Cadence and what a week-over-week comparison means |
|---|---|
| Contract volume | Resets at each open; comparable across days only against that day's own baseline |
| Premium committed | Resets at each open; sensitive to contract price, so cheap expiries compress it |
| Trade count | Resets at each open; separates one large print from a long sequence of small ones |
| Estimated side | Resets at each open; an inference from quote location, never a confirmed buyer or seller |
| Open interest | Published once daily after the close; the only field that confirms whether positioning grew |
| Strike concentration | Accumulates across sessions; the most durable weekly observation available |
Why does the overnight open-interest settle rewrite the previous session?
OCC publishes open interest once a day, after the close, once opening and closing activity has been reported and exercise and assignment have been processed. Nothing intraday, from any vendor, is a real open-interest figure. That single cadence fact is what makes a week-scale read structurally different from a day-scale one.
Read the supporting context
The practical consequence is that Tuesday's flow cannot be fully interpreted until Wednesday morning. A strike that absorbed heavy Tuesday volume can show a large open-interest increase, a small one, or a decrease, and each of those turns the same tape into a different story. A week gives you four overnight settles to check four days of assumptions, which is exactly the advantage a single session does not have.
- Large volume, large open-interest increase: consistent with new positioning at that series, though it does not say by whom or in which direction.
- Large volume, roughly unchanged open interest: consistent with transfers between participants, one side opening while the other closed.
- Large volume, open-interest decrease: consistent with closing activity, including rolls out of that series into another expiry.
- Any of the above with a matching change at a second strike or expiry: consistent with a spread or roll rather than an outright position.
Why does the 0DTE mix change across the week?
SPY lists an expiration on every trading weekday, so every session contains same-day contracts. What changes is how much of the week's remaining structure sits alongside them. Monday's tape carries four more SPY expirations ahead of it inside the week; Friday's carries none, and it also carries the weekly and, at month end, monthly series expiring into the same close.
Read the supporting context
That mix changes what a raw call-versus-put number means without anyone changing their opinion about the market. A Friday reading blends same-day activity with the closing, rolling and exercising of everything that expires that afternoon. Comparing Friday's mix directly with Monday's compares two different calendars, not two different moods.
- Separate same-day expiry activity from the rest of the chain before comparing any two sessions.
- Expect closing and rolling activity to be heaviest into the sessions where large series expire.
- Treat a shift in the 0DTE proportion as a calendar effect first and a behaviour change only if it persists after the calendar is controlled for.
- Read short-dated gamma exposure as a model output that changes with spot through the day, not as a level the week is working towards.
In what order should a five-session SPY flow review run?
The reading order matters more than the number of screens. Start with the field that is already settled, then move to fields that are still provisional, so the least reliable evidence never gets to frame the most reliable.
- Open with last night's settled open interest by strike and expiry, since it is the only confirmed positioning number you have.
- Add the week's cumulative premium and trade count by day to see whether activity is concentrated in one session or spread across five.
- Overlay the underlying price path, so a build in flow can be checked against whether price actually moved with it.
- Mark the strikes that appear in more than two sessions; single-session appearances are noise more often than they are structure.
- Check for dated catalysts inside the week, since scheduled events explain a large share of what otherwise looks like conviction.
- Only then write anything down, and write it as observations with their unresolved alternatives attached.
How can a weekly SPY flow note avoid making a prediction?
A defensible weekly note records what was observed, what the observation is consistent with, and what would change the reading. It does not contain a view about next week, because nothing in the data supports one. Flow describes activity that has already happened, side is an estimate, and no field in the dataset is forward-looking.
Read the supporting context
Written this way, the note stays useful when you return to it. A note that says put open interest at a given strike rose across three sessions while price held above it remains a factual record. A note that says the market is positioning for a decline is an interpretation that will be either embarrassing or accidentally flattering, and neither outcome teaches you anything.
| Write this | Not this |
|---|---|
| Open interest at the strike rose on three of five sessions | Institutions are building a position at the strike |
| Premium concentrated in same-day expiries on two sessions | Traders are getting short-term aggressive |
| Put premium exceeded call premium while price rose | The market is hedging for a fall |
| Repeat prints appeared at one strike across the week | Someone knows something about this level |
| Modelled gamma exposure clustered near a strike | Price will be pinned to the strike |
Where does a weekly SPY options-flow review go wrong?
The most common failure is treating the week as a narrative with a beginning and an end. A week is an arbitrary window; positions routinely span expiries far outside it, and a large Thursday print may be the second leg of something that started three weeks earlier in a series you never looked at.
Read the supporting context
The second failure is asymmetric attention. It is easy to notice the sessions that agreed with an early impression and to skim the ones that did not. Reviewing the week in fixed order, with the settled data first, is a cheap structural defence against that.
- The week boundary is arbitrary; positions do not respect it.
- Estimated side is an inference from quote location and stays an inference no matter how many days you aggregate.
- Repeat activity at one strike may be one participant, several, or a market maker managing inventory.
- Realtime Options does not backtest, so a weekly note is a record to reread, not a strategy you can test in the product.
Common questions
Why does open interest change how I read yesterday's options flow?
Open interest is published once daily after the close, once OCC has processed opening and closing activity along with exercise and assignment. Until that figure arrives, you cannot tell whether heavy volume at a strike created new positions, transferred existing ones or closed them, and those three cases support very different readings of the same tape.
Is intraday open interest available anywhere?
No. Open interest updates once a day after the close, and no vendor can supply a genuine intraday figure because the number does not exist until the clearing process completes. Any product presenting live open interest is showing either the prior day's settled figure or an estimate.
Does a Friday reading mean more than a Monday reading in SPY?
It means something different rather than something more. SPY lists an expiration on every trading weekday, so Friday blends same-day activity with the closing, rolling and exercising of larger weekly and monthly series expiring into that afternoon. The mix, not the conviction level, is what changed.
How many sessions do I need before a strike counts as persistent?
There is no threshold that turns activity into evidence. As a working habit, a strike that appears in a single session is usually noise, and one that recurs across several sessions with a corresponding open-interest change is at least worth a structured check. Recurrence raises the question; it does not answer it.
Can a week of options flow tell me what happens next week?
No. Options flow records executed activity, estimated side is an inference, and no field in the dataset is forward-looking. A weekly read can describe where activity and outstanding positioning concentrated, which is a description of the past, not a forecast of the next five sessions.
Should I compare SPY flow week over week?
Only with the calendar controlled for. Weeks differ in the number of expirations, the size of the series expiring inside them and whether scheduled events fall within them. Comparing raw weekly totals across those differences measures the calendar at least as much as it measures participant behaviour.