


Flow Map and Greeks by Strike dashboard
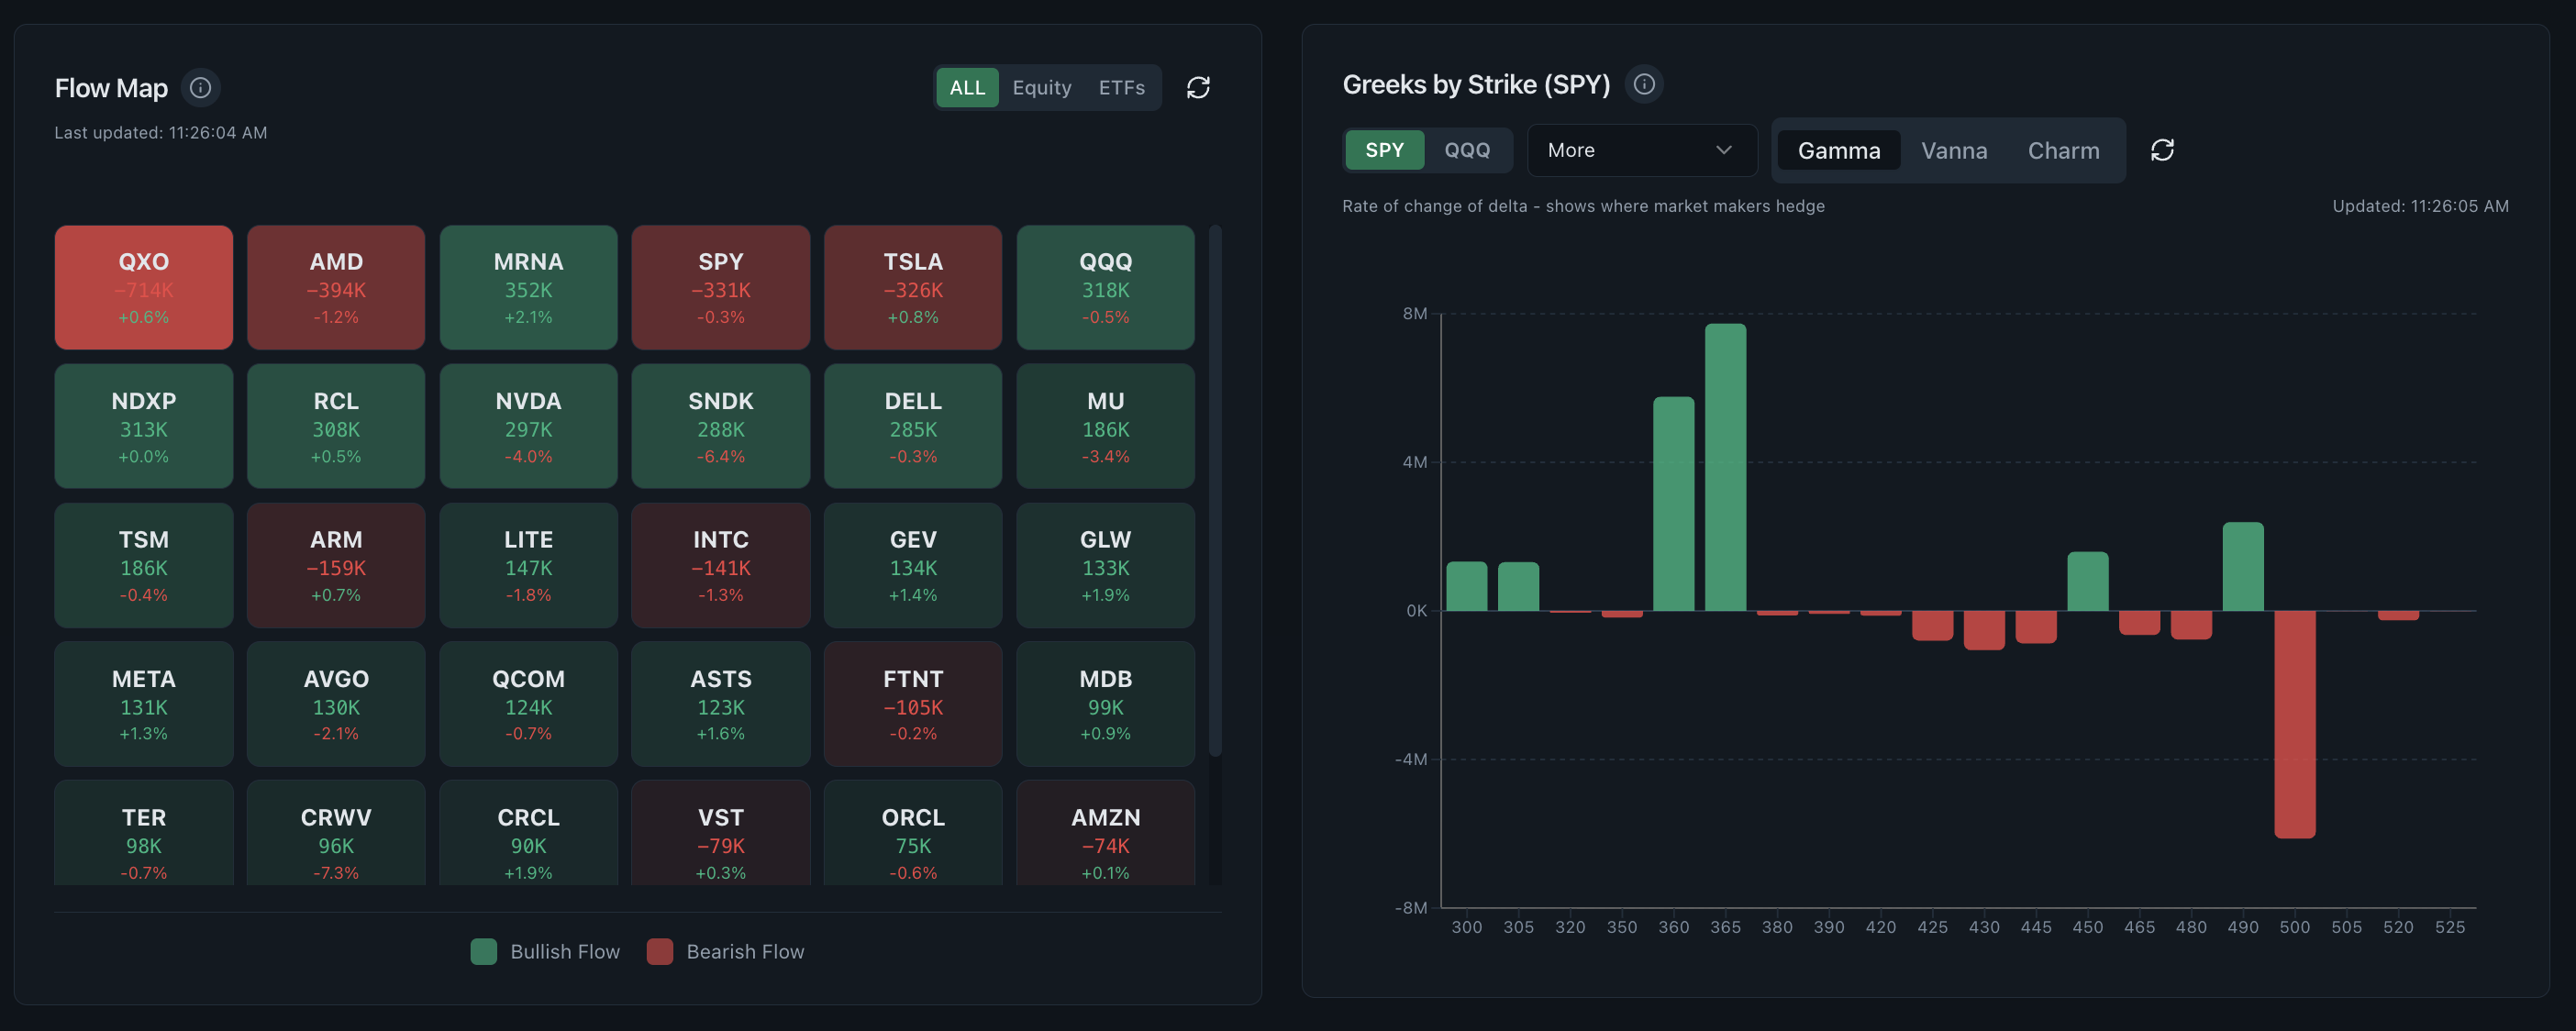
The Flow Map ranks bullish and bearish ticker activity while the adjacent strike chart plots gamma, vanna and charm. The combined screen bridges two research levels: which names are attracting options premium and where their modeled exposure is concentrated across strikes.
- Research question
- Where is flow building and where can hedging sensitivity matter?
- Best used for
- Moving from market-wide rankings to strike-level exposure
- Data timing
- Near-real-time Pro; 15-minute delayed trial
- Product access
- Included in the single $29/month plan
What the flow map and greeks by strike dashboard shows
The screen connects observed premium with model-derived sensitivities. That is useful because high activity and high exposure answer different questions: one describes what traded, while the other estimates how option values and hedging needs may respond to changing inputs.
Read the supporting context
The screenshot above is from the working product, not a mockup. The visible controls and fields are the same ones trial and Pro users research with; only the market-data timing changes between the two access levels.
- Bullish and bearish ticker tiles ranked by net premium.
- Gamma by strike for estimated delta sensitivity.
- Vanna by strike for sensitivity involving implied volatility.
- Charm by strike for the effect of time on delta.
How to read this dashboard
Read the dashboard as one step in a sequence. Record what it directly shows first, then use the next view to test the interpretation rather than turning a color or ranking into a conclusion.
- Use the flow tiles to choose a small research set rather than the highest number alone.
- Select a ticker and mark spot relative to the largest exposure strikes.
- Compare gamma with vanna and charm instead of using one Greek as the whole explanation.
- Open the heat grid and contract history for the strikes that remain relevant.
What this view cannot establish
Greeks are theoretical guideposts rather than exact forecasts. They change as price, volatility and time change, and aggregate exposure requires assumptions about position direction that public data cannot always prove.
Read the supporting context
Realtime Options organises observed and derived market data for independent research. Read each view with its stated method, assumptions and surrounding context.
Common questions
What does Greeks by strike show?
It groups model-derived sensitivities such as gamma, vanna and charm at each strike so researchers can see where exposure is concentrated around the underlying price.
Why pair an options flow map with Greeks?
Flow identifies active names; Greeks help locate the modeled exposure inside those names. Pairing them reduces the temptation to treat a ticker ranking as a complete explanation.
Are options Greeks exact?
No. The Options Industry Council describes Greeks as theoretical guideposts. Their values depend on changing pricing inputs and the chosen model.
Is Greeks by Strike available through Public API v1?
Yes. Eligible Pro accounts can call GET /api/public/v1/market/greeks-by-strike with symbol and optional date. It returns the same strike, gamma, vanna and charm values used by the dashboard, plus source coverage metadata. All API endpoints share the account's quota and require a bearer key and endpoint permission.