


Contract Activity Review
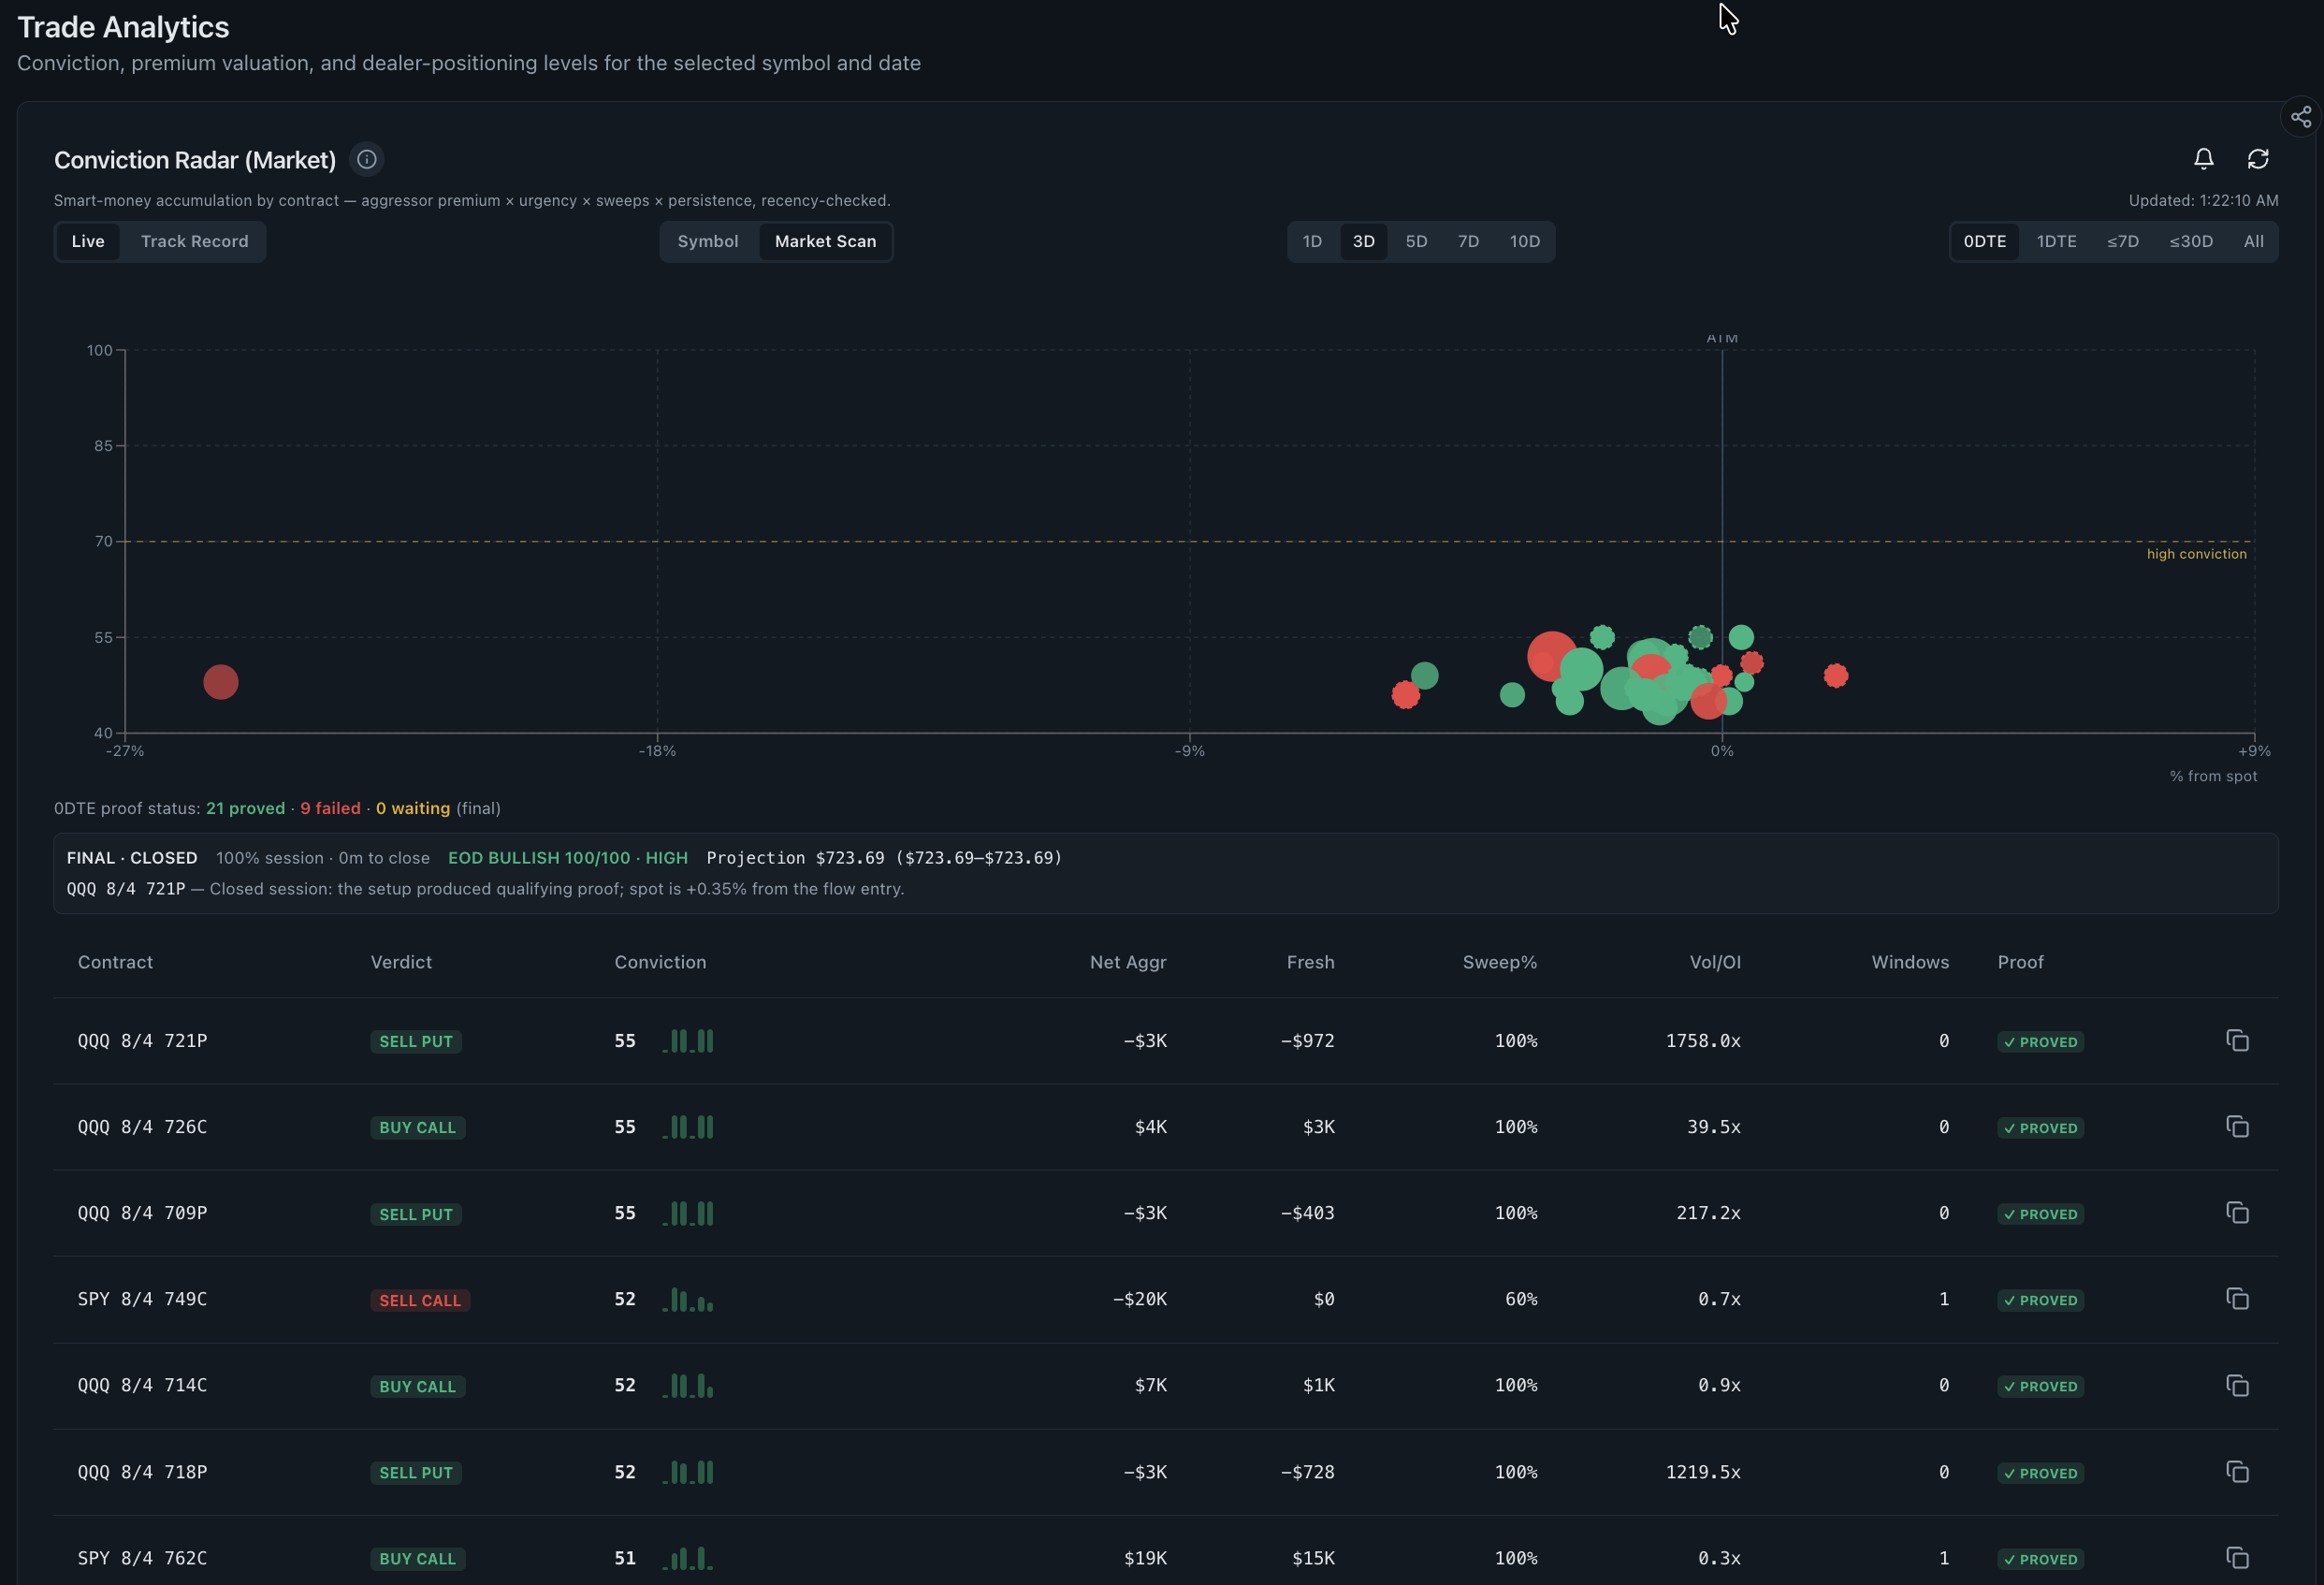
Contract Activity Review plots options contracts using classified premium, urgency, sweep share, persistence and recency, then records whether defined historical comparison conditions were met. It supports model review and deeper contract research.
- Research question
- Which contracts deserve deeper evidence review?
- Best used for
- Prioritising contracts while reviewing the model inputs
- Data timing
- Near-real-time Pro; 15-minute delayed trial
- Product access
- Included in the single $29/month plan
What the contract activity review shows
The view makes the model inspectable: ranking inputs, historical comparison status and underlying contract rows remain visible together. A medium score with broad context can be more useful than a dramatic label supported by one print.
Read the supporting context
The screenshot above is from the working product, not a mockup. The visible controls and fields are the same ones trial and Pro users research with; only the market-data timing changes between the two access levels.
- Contract bubbles positioned by distance from spot and model score.
- Classified net aggressor premium, fresh premium, sweep share and volume-to-OI context.
- Historical comparison states for defined matched, unmatched and pending conditions.
- Contract table with model status, comparison windows and copyable identifiers.
How to read this dashboard
Read the dashboard as one step in a sequence. Record what it directly shows first, then use the next view to test the interpretation rather than turning a color or ranking into a conclusion.
- Choose the market or symbol scope and a consistent lookback before ranking contracts.
- Use the score to prioritise inspection, not to skip inspection.
- Check distance from spot, expiry, premium, volume-to-OI and the number of evidence windows.
- Review matched and unmatched definitions before interpreting the historical status.
- Open price, open-interest and news views to test alternative explanations.
What this view cannot establish
Aggressor direction and sweep labels are derived from public execution data and can misclassify complex orders. Historical status follows the tool's defined comparison rule and should be read as descriptive model context.
Read the supporting context
Realtime Options organises observed and derived market data for independent research. Read each view with its stated method, assumptions and surrounding context.
Common questions
What does Contract Activity Review organise?
It ranks observed contract data for further research and keeps the underlying fields visible for review.
What does the model score measure?
It combines defined inputs such as classified premium, urgency, sweep share, persistence and recency into a heuristic research score.
How should the directional labels be read?
They describe how observed option-contract activity was classified from public quote context and should be checked against the supporting data.