


Options trading dashboard for connected market research
An options trading dashboard should connect market-wide flow, ticker activity, strike and expiry positioning, underlying price and catalysts in one research path. Realtime Options provides ten browser dashboards for those jobs at $29 per month, with a 3-day no-card trial on delayed data. It is analytics software, not a broker terminal or signal room.
- Dashboards
- 10 connected research views
- Coverage
- US-listed stocks and ETFs with active options
- Price
- $29/month after a 3-day no-card trial
- Not included
- Broker execution, raw data API or trading signals
The ten dashboard jobs
Each dashboard should answer a different research question. Repeating the same flow table ten ways creates more tabs, not more context.
- Weighted Net Flow: is call or put pressure confirming the underlying price?
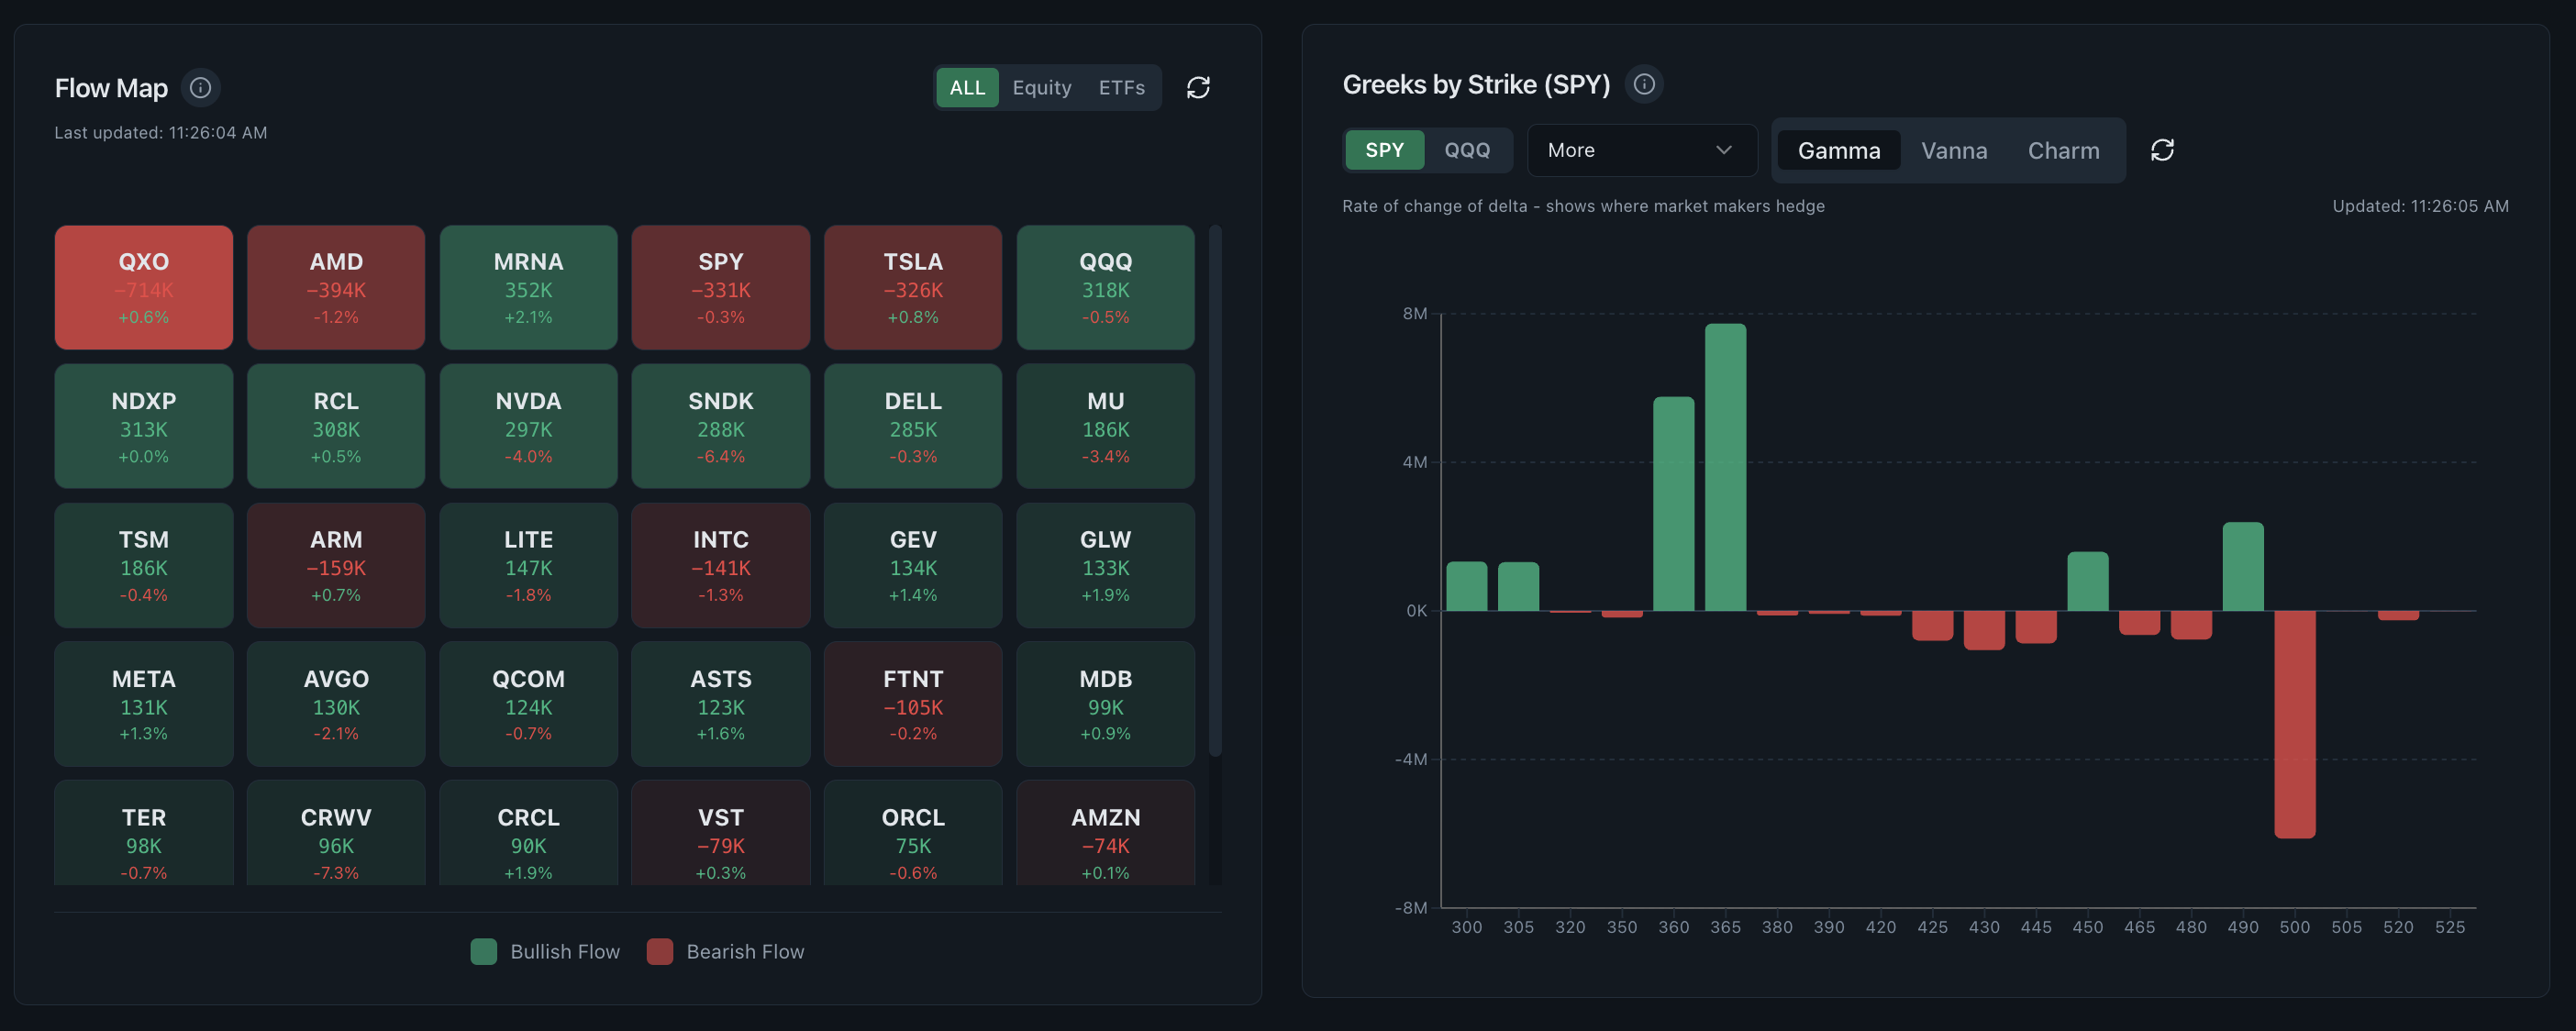
- Flow Map and Greeks: which tickers and strikes carry the strongest exposure?
- Premium Heat Grid: where do premium, GEX and VEX concentrate by expiry?
- Sector and Ticker Flow: where is market-wide attention rotating?
- 0DTE and GEX: where is same-day gamma concentrated around spot?
- Algo Flow and Top Tickers: which names deserve a closer screen?
- Contract Positioning: how did ask-, mid- and bid-side premium develop on one contract?
- Flow Trend: is the current session unusual relative to recent history?
- Premium and Open Interest: where does fresh activity meet existing positioning?
- Market News: what scheduled or reported catalyst may explain the flow?
Why connected dashboards beat a wall of alerts
Alerts optimize for interruption; a connected dashboard optimizes for verification. The difference matters because unusual size is not automatically directional and a bullish label can hide a hedge, spread, roll or closing trade.
Read the supporting context
The platform deliberately supports a narrowing sequence: market, sector, ticker, strike, contract and catalyst. Internal links between dedicated tool guides explain what each screen contributes and what it cannot establish.
Who this dashboard is and is not for
The dashboard is for self-directed traders, educators and independent analysts who understand basic options terminology and want to reduce tab switching. It is not a fit for someone seeking order entry, automated execution, personalized advice, raw exchange redistribution or Indian F&O signals.
Read the supporting context
The three-day trial exists to test that fit. Delayed data is sufficient to evaluate navigation and research structure; it should not be used as live execution timing.
Common questions
What should an options trading dashboard include?
At minimum: call and put flow, premium, volume, trade count, open interest, strike and expiry context, Greeks, underlying price and relevant news. The views should link to one another rather than operate as isolated alerts.
Is the options trading dashboard free?
All ten dashboards are free to evaluate for 3 days on 15-minute delayed data with no card required. Near-real-time Pro access is $29 per month.
Can I trade from the dashboard?
No. Realtime Options has no broker connection or order ticket. It organizes market analytics for research; execution stays with your brokerage account.