


What trading analytics should you monitor in real time?
Nine, and the order matters more than the list. Read market-wide direction first (call versus put pressure, then net premium), confirm it is real (volume and trade count, then open interest), check who has to hedge it (gamma exposure, then 0DTE positioning), and only then narrow to a ticker (price confirmation, sector and ticker flow, news). Reading any single one alone is how people talk themselves into a position the rest of the data does not support.
- How many
- Nine, read in sequence
- Read first
- Market-wide, not ticker-level
- Most misread
- Volume without trade count
- Updates once daily
- Open interest, after the close
1-2. Direction: call versus put pressure, then net premium
Start with whether the market as a whole is leaning calls or puts, because a bullish print inside a broadly bearish tape means something different from the same print on a bullish one. Weighted net flow plots both sides against price on a single intraday view.
Read the supporting context
Net premium then weights that lean by money rather than contract count. A hundred thousand cheap 0DTE calls and one large longer-dated block produce very different premium figures from similar volume, and premium is the more honest of the two.
3-4. Confirmation: volume with trade count, then open interest
Volume alone is easy to overread. Five thousand contracts can be one block or thousands of smaller trades, so read volume beside trade count and premium before describing the activity.
Read the supporting context
Open interest adds the latest cleared positioning context. It updates once per day after the close, so it can support a next-session review but cannot establish whether an intraday print opened or closed a position.
5-6. Mechanics: gamma exposure, then 0DTE positioning
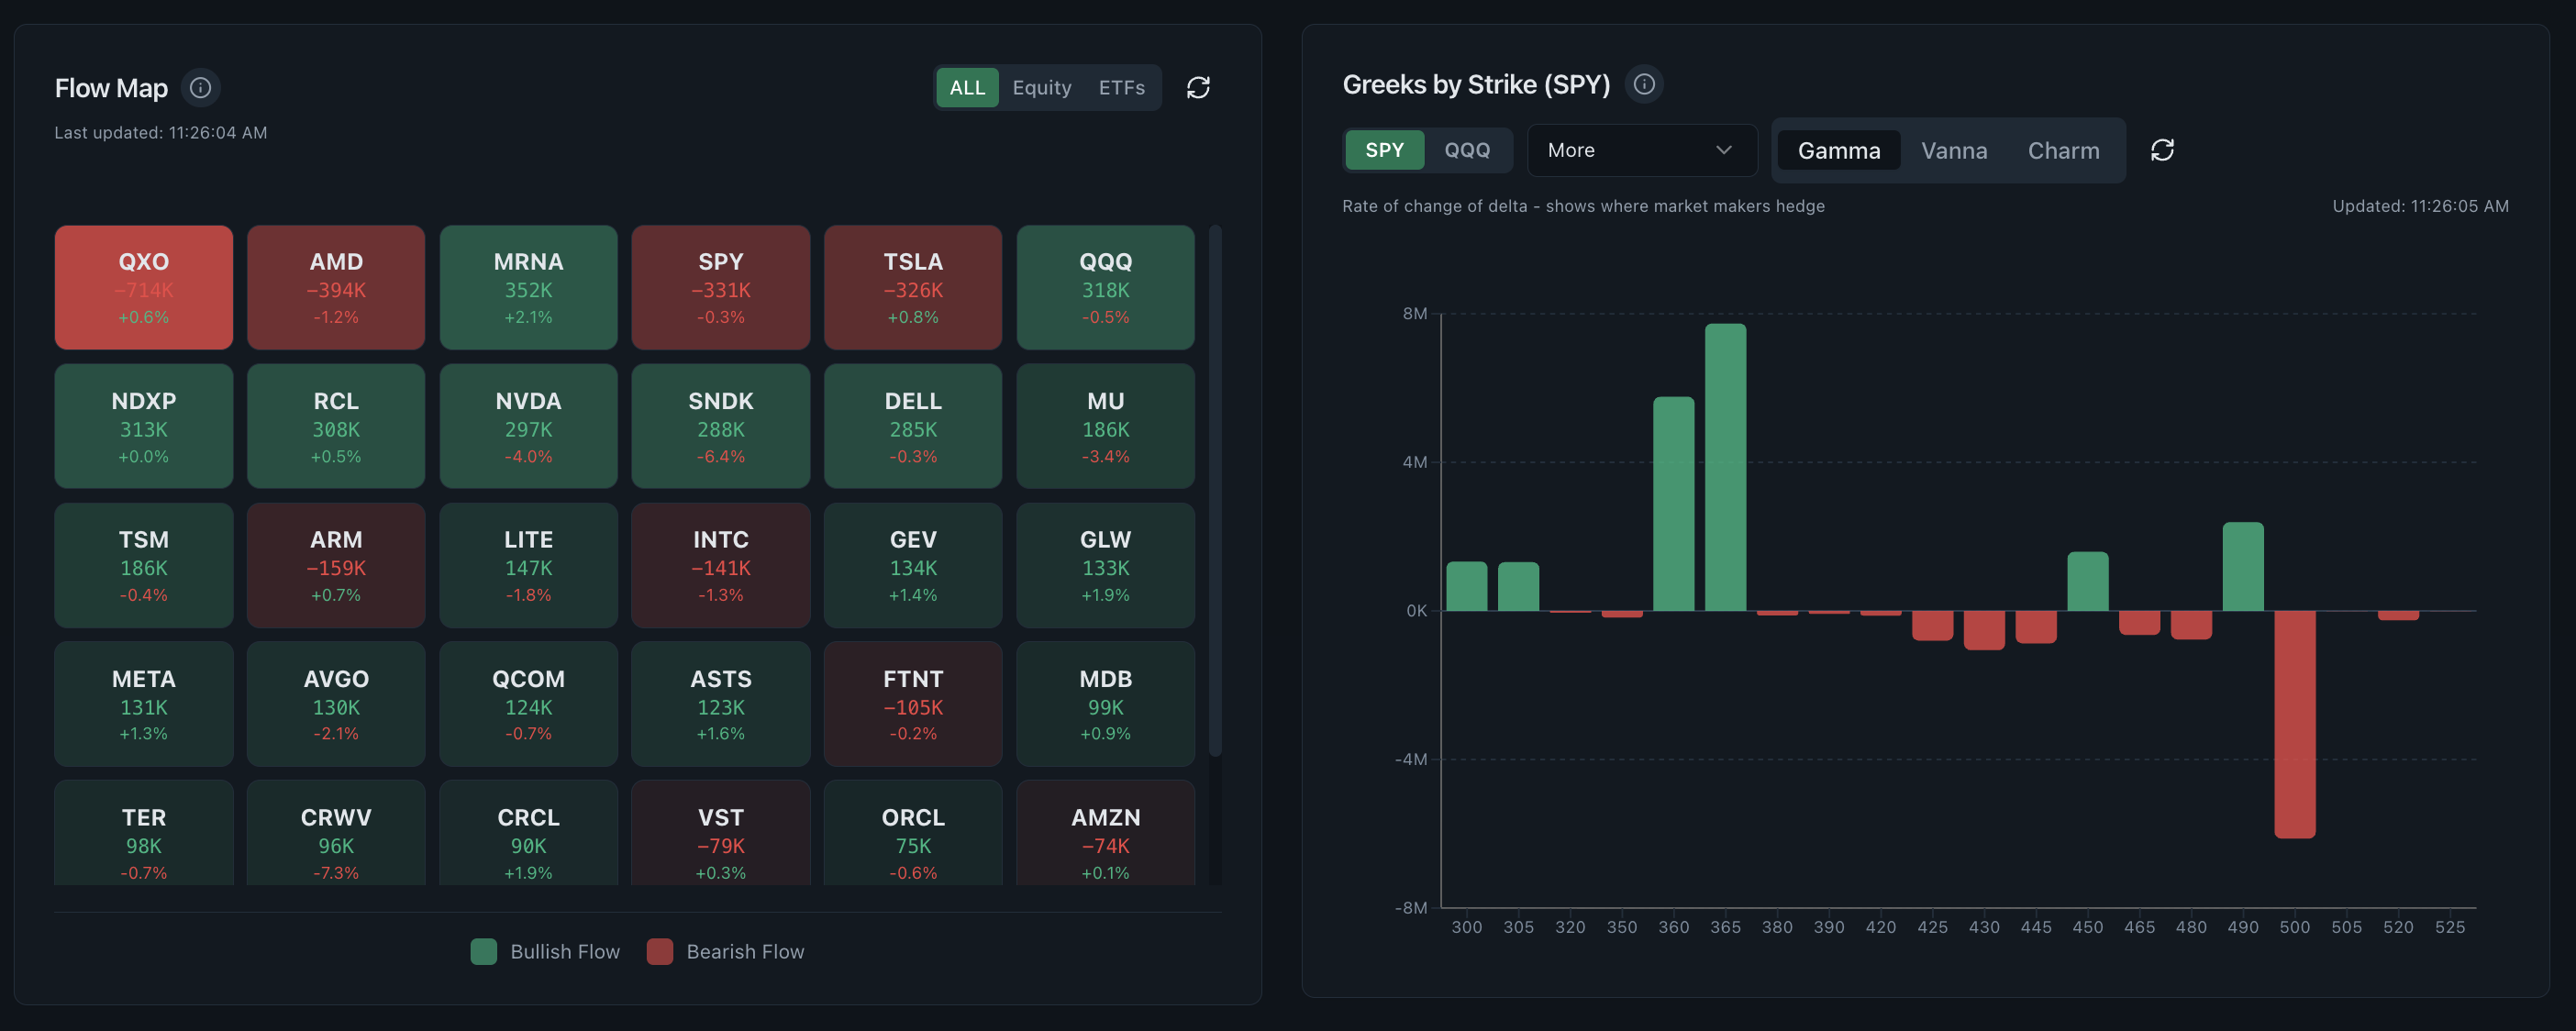
Gamma exposure estimates how option delta and related hedging sensitivity may change as price moves. The estimate depends on model inputs and assumptions about positioning, so it is context rather than a forecast of market behavior.
Read the supporting context
0DTE contracts can concentrate short-dated gamma near spot as expiration approaches. A same-day heat grid therefore answers a different timing question from the same view on monthly expiries.
7-9. Narrowing: price confirmation, sector and ticker flow, news
Price context is the discipline step. Flow that disagrees with price remains an open question because the activity may involve hedging, rolling or gradual positioning.
Read the supporting context
Sector and ticker flow ranks where the market-wide activity is concentrated. Market news comes last, to check whether a print has a public explanation such as an earnings date, dividend or index rebalance before building a story around it.
The mistake underneath all nine
Every one of these can look decisive in isolation. The value of keeping them together is that one reading can be checked against the other eight before a single impressive-looking print becomes a full explanation.
Read the supporting context
Together, the nine measurements form a research sequence: observe, compare, narrow and document what remains unresolved.
Common questions
What should I check first during market hours?
Market-wide call versus put pressure, before anything ticker-specific. A print only means something relative to the direction of the whole tape, so narrowing before you have that context produces confident conclusions from incomplete data.
Is open interest available in real time?
No, from any provider. Open interest is published once per day after the close by the OCC. Intraday, you are looking at yesterday's figure, which is still useful for telling opening from closing positions but is not live.
Do these analytics predict price?
They describe positioning and activity that has already happened. Historical patterns and modeled levels remain context rather than forecasts.